What Becomes of a Broken Stock Market?
Stock-Markets / Stock Markets 2010 May 18, 2010 - 12:38 PM GMTBy: EWI
 There are two possible Elliott wave paths for stocks from here -- but only one likely outcome.
You know what a mystery the Dow's 1,000-point drop on May 6 has been.
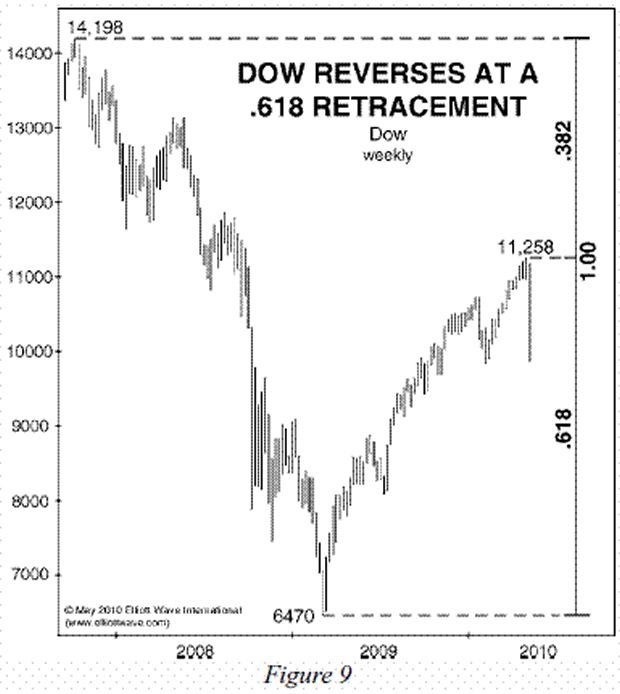
Wall Street is looking for a smoking gun -- a trader's mistake, a computer glitch -- but nothing definite has been found yet. If you're familiar with Elliott wave analysis, last week's shocking decline gets less mysterious. The chart you see below is from Robert Prechter's latest, May Elliott Wave Theorist. Notice the price area where the drop occurred.
Read Part One of Robert Prechter's Latest Two-Part, April-May Theorists FREE The April-May Theorist series entitled "Deadly Bearish Big Picture" reveals a lucid picture for 2010-2016. It's the flipside of Robert Prechter's February 2009 Forecast for a 'Sharp and Scary' Rally. Click here to download the 10-page part one for FREE now.

As you see from Prechter's chart, the Dow reversed after the rally off the March 2009 low had retraced about 61.8% of the 2007-2009 crash. To be exact, "The Dow met the .618 retracement level when it reached 11,258 at 11:15 a.m. EST on April 26. Then it reversed, as shown in Figure 9," writes Bob in the May Theorist.
Why is that important? Because in Elliott wave analysis, .618 is a common Fibonacci reversal area for market corrections.
Based on the Dow's 300-year-long Elliott wave pattern, Prechter sees a huge difference now compared to the last two significant tops in 2000 and 2007. In fact, "This massive stock market top is preparation for something big," writes Bob.
The May 8 Theorist shows you two Elliott wave paths that stocks will likely take from here -- and both point in the same direction.
There is more -- you also discover the likely final outcome if this decline indeed develops into "something big": Prechter gives you his ultimate DJIA's price targets several years from now.
Read Part One of Robert Prechter's Latest Two-Part, April-May Theorists FREE The April-May Theorist series entitled "Deadly Bearish Big Picture" reveals a lucid picture for 2010-2016. It's the flipside of Robert Prechter's February 2009 Forecast for a 'Sharp and Scary' Rally. Click here to download the 10-page part one for FREE now.
This article was syndicated by Elliott Wave International. EWI is the world's largest market forecasting firm. Its staff of full-time analysts lead by Chartered Market Technician Robert Prechter provides 24-hour-a-day market analysis to institutional and private investors around the world.
© 2005-2022 http://www.MarketOracle.co.uk - The Market Oracle is a FREE Daily Financial Markets Analysis & Forecasting online publication.


