


U.S. Interest Rates Remain on Hold or Heading Higher?
Interest-Rates / US Interest Rates May 22, 2010 - 03:04 PM GMTBy: John_Mauldin

 The Case for a Fed Rate Hike
Employment Is Turning the Corner
The Headwinds of Money Supply
Who Stole the Inflation?
The Fed Is On Hold
An Inverted Yield Curve?
LA, Vancouver, San Francisco, and a First
Often Wrong, Seldom in Doubt
Everywhere there are arguments that we are in a "V"-shaped recovery. And there are signs that in fact that is the case. Today we will look at some of those, and then take up the topic of when the Fed will raise rates. We open the case and look at the evidence. Is there enough to come to a real conviction? I think there is. (And at the end of the letter I mention two conferences I am speaking at in the next few months, in Vancouver and San Francisco.)
But first, a little housekeeping. The delivery rate for this letter has not been good for some time now and we are aware of it. We get tons of letters and calls from long-time readers who want to know why we have dropped them from the list. They keep resubscribing but not getting the letter. It is a problem. I was not getting delivery on my own personal accounts from well-known email providers. We apologize for any inconvenience. Please know that we do not drop anyone from the list unless they request it or we get hard bounces or undeliverable messages.
Hopefully that has all changed with this letter. The problem has been that the list is so large that it is blocked long before the letter ever hits your inbox. The computers at service providers just assume anything this large can't be for real. We are now using a service that is a third-party verification of our letter, which hopefully will fix the problem (not a cheap solution, by the way!). So, there may be a lot of you for whom this letter is (hopefully) a pleasant surprise after not getting it for some time.
If that is the case, we would like to know. If you have the time, drop me a response that says "got it" in the subject line. And of course, if you don't want to get the letter you can hit the unsubscribe button at the bottom. But even better, why not forward this to a friend and tell them to subscribe?
For the record, we are working on a MAJOR revision of the website and the letter. There will be a lot more ways for you to interact with me and each other. A lot more information and capabilities. We are excited. It should be here by the fall. Tiffani and I think you are really going to like it. And now to the letter.
Employment Is Turning the Corner
There is a little-known employment report that the BLS (Bureau of Labor Statistics) releases late in the month that is a summary of the employment reports from the 50 states. Of late, this number has been higher than the federal government survey. Adding the states together, we find that 412,200 jobs (non-seasonally adjusted) were created in April, higher than the establishment survey (which for whatever reason gets the headlines) and more in line with the household survey, which showed an employment gain of 550,000 (seasonally adjusted).
I think it is well established by now that I am not a fan of the birth/death employment estimates in the establishment survey. That is where the BLS estimates the number of new jobs created by the birth or death of new businesses. It is often a significant portion of the jobs survey and it is a seasonally adjusted guess. There really is no alternative but to make this estimate, but at the beginnings of recessions it always overestimates the number of jobs, and at the beginnings of recoveries it will underestimate them.
Remember the "jobless recovery" of 2002-2004? Eventually (several years later) the BLS gets hard data from tax and other sources and goes back and revises the employment numbers. No one cares, because it is "old news." But we can now look back and see the jobless recovery we thought we were in was not all that bad. The birth/death estimates decidedly understated the growth that was going on at the time.
That may be the case now, too. The much stronger state and household surveys suggest that we *may* be at the beginning of a labor recovery that will be understated by the establishment survey, as the birth/death model just won't catch that growth. If this pattern continues for the next few months, I think we should begin to pay more attention to the state and households surveys. Let's hope it does.
That being said, the level of reported increases is not showing up in the income tax reports. There may be several reasons for that, one of which is that people are going back to work for less money and thus paying less taxes. And that would make sense, as there are now five out of work people seeking jobs for every job opening. The employers have the negotiating power.
Businesses are cautiously building inventories and bringing people back to work. Sales-to-inventory levels are not out of line and suggest we may see more inventory building this quarter, which will directly help boost GDP. Retail sales growth is modest by previous recovery standards, but there is at least growth.
The Headwinds of Money Supply
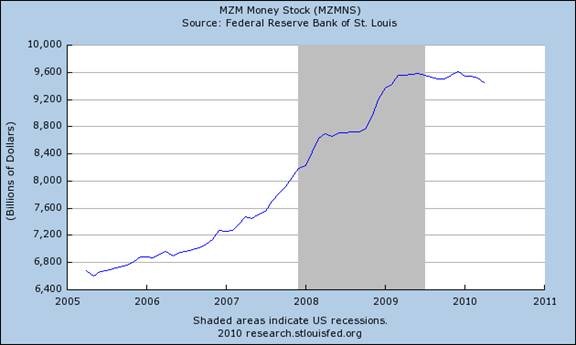
But (and you knew there would be a but coming), there are some headwinds we need to deal with before we can sound the all-clear horn. First, growth in the money supply is slowing. Let's look at the measure of money supply called MZM, or Money of Zero Maturity. Notice it was flat for well over a year and actually down the last two months.
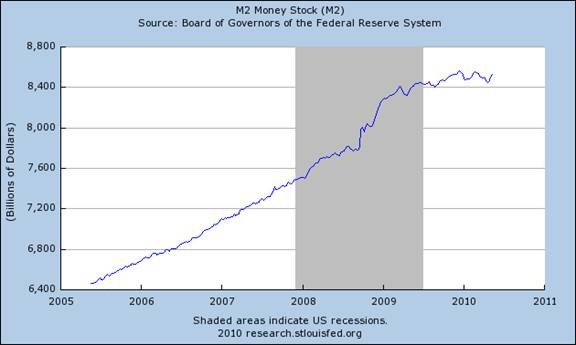
A broader measure of money is M2. Notice that it too has flat-lined for well over a year. If we look at the last 30 years, there is nothing you can see in the chart that even comes close to this.
I don't have access to a graph of M3, though it is still produced by several groups (the Fed stopped several years ago), but that chart would show that even M3 has gone negative. Remember the conspiracy guys who thought the Fed stopped reporting M3 because they thought the Fed wanted to hide the fat that it was going to increase the money supply by large amounts and destroy the dollar? Hardly. The economists at the Fed simply felt for a number of very public reasons that M3 doesn't have any real meaning any more. They have a strong case, although I never understood why they just didn't go ahead and keep publishing it anyway. It was just a few computers programs. But what do I know?
Now, notice that with both graphs you see a large increase beginning in the middle of 2008 as the Fed pumped the money supply in order to inject liquidity into the system. This was basically the $1.25 trillion purchase of mortgages, but toward the end even that was not boosting the money supply as much as it did in the beginning. Why? Partially, because of the following graph.
This shows total commercial lending at US banks. It is down almost 25% in less than a year and a half. Notice that in the last recession commercial lending dropped by "only" 18% in 3.5 years.
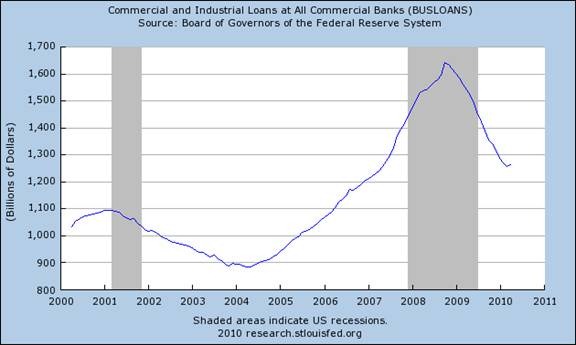
Lending to consumers is also down in a similar fashion. Notice that money supply begins to go flat in 2009, just a little after bank lending dried up.
Remember our old friend the equation that GDP is equal to the money supply times the velocity of money (GDP=MV)? If GDP is growing and the money supply is slowing, that means the velocity of money is starting to turn back up. That would be a good thing, but we must be somewhat cautious, in that the velocity of money is mean reverting over time, and it is still well above its mean. If it started to once again slow down, as it has for several years now with the current slow or no growth in the money supply, that would not be good for GDP growth.
As a practical matter, that means the Fed will not be reducing its mortgage holdings any time soon. They will wait until it is obvious that a recovery is firmly entrenched. I don't see how they can risk reducing the money supply any more than they already have, especially given the next few charts.
Who Stole the Inflation?
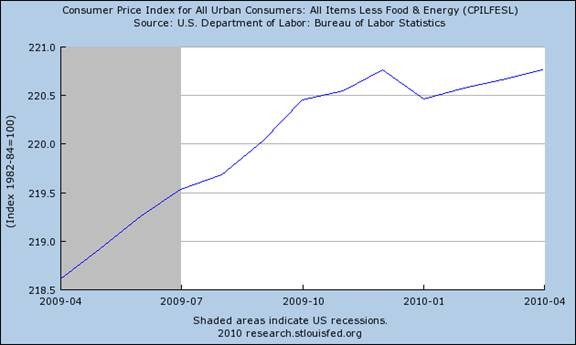
Inflation just isn't what it used to be. Core inflation is basically flat over the last year. We haven't seen that since the '50s. Since the beginning of 2009 it is only up around 0.1%.
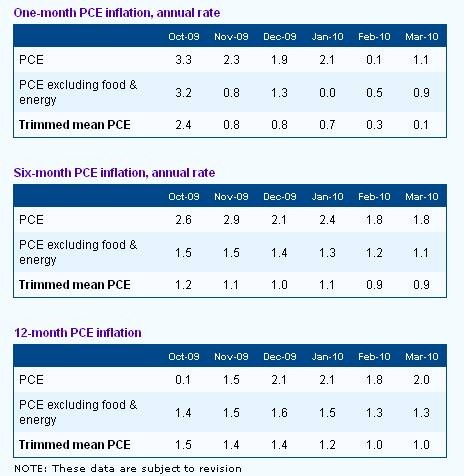
About five years ago, the Dallas Fed developed a new methodology for measuring inflation, called the Trimmed Mean PCE. It was developed by Dallas Fed economist Jim Dolmas.
Dolmas notes (quite correctly, I think) that to exclude food and energy, just because they are volatile, ignores that other quite volatile measures of inflation are still left in. Further, energy and food inflation do have meaning in the real world.
What Dolmas does is use a statistical device called "trimming." From the field of statistics, trim analysis borrows the idea of ignoring a few "outliers." A trimmed mean, for example, is calculated by discarding a certain number of lowest and highest values and then computing the mean of those that remain.
How accurate is his measure? Dolmas suggests it is a lot more accurate: "That is to say, compared to the usual ... measure, on average the monthly Trimmed mean measure would be expected to come closer to true monthly core inflation by roughly .75 of a percentage point, when the inflation rates are expressed in annual terms." That is huge, at least in my book, especially when we look at how great the difference is with the Fed's favorite methodology.
In 2006, the trimmed-inflation methodology suggested the core inflation was understating inflation. Today, the same methodology suggests that core inflation is overstating inflation. Look at the tables below, which were last updated in March. The trends in inflation are clearly down, and when the April data comes out it will be down again.
My good friend David Rosenberg pointed out this morning a new study by the Cleveland Fed on inflation, which concludes that: (i) the decline in recent months has transcended the housing effect; and, (ii) the principal risk is for a further slowing. Treasury yields are likely headed even lower. The title of the report is Are Some Prices in the CPI More Forward Looking Than Others? We Think So, by Michael F. Bryan and Brent Meyer. It's well worth a read. ( http://www.clevelandfed.org/Research/commentary/2010/2010-2.cfm)
"Abstract: Some of the items that make up the Consumer Price Index change prices frequently, while others are slow to change. We explored whether these two sets of prices - sticky and flexible - provide insight on different aspects of the inflation process. We found that sticky prices appear to incorporate expectations about future inflation to a greater degree than prices that change on a frequent basis, while flexible prices respond more powerfully to economic conditions-economic slack. Importantly, our sticky-price measure seems to contain a component of inflation expectations, and that component may be useful when trying to gauge where inflation is heading.
"Conclusion: Where is inflation heading? Well, the last FOMC statement held the view that ‘inflation is likely to be subdued for some time.' We certainly don't have reason to question that outlook. Indeed, while the recent trend in the core flexible CPI has risen some recently (it's up 3.3 percent over the past 12 months ending in March) the trend in the core sticky-price CPI continues to decline. Even excluding shelter, the 12-month growth rate in the core sticky CPI has fallen 1.1 percentage points since December 2008, down to 1.8 percent in March. So on the basis of these cuts of the CPI, we think ‘subdued for some time' sums up the price trends nicely."
And speaking of the latest minutes from the last Fed meeting, which came out this week, let's review a paragraph.
"In light of stable longer-term inflation expectations and the likely continuation of substantial resource slack, policymakers anticipated that both overall and core inflation would remain subdued through 2012, with measured inflation somewhat below rates that policymakers considered to be consistent over the longer run with the Federal Reserve's dual mandate."
The Fed Is On Hold
Let's review. Economists tell us it will take GDP growth rates of 3.5% or more to have any real impact on employment. As I have noted elsewhere, that is 300,000 jobs a month for five years to get us back to where we were in 2007. Losing 8 million jobs is a big hole. What are the prospects for 3.5% GDP growth, with high unemployment and large tax increases coming in 2011from not only the Fed but state and local governments? My thought is, not so great.
The trend in inflation is down. Unemployment is way too high. The money supply is somnolent.
The Fed is on hold for the rest of the year and well into 2011.
Case closed.
An Inverted Yield Curve?
A quick thought on inverted yield curves. As long-time readers know, I have written extensively about research done on the inverted yield curve, that condition where short-term rates are higher than long-term rates. It is the best single indicator of recessions, and following it allowed me to "predict" the last two recessions a year in advance. We won't go now into why it seems to work, but it is useful, or has been in the past.
Clearly, if the Fed is on hold for at least another year, it will be impossible for quite some time to get an inverted yield curve. Obviously, long-term rates will not go below zero. Yet long-term rates are headed down of late, and are lower than they were when we last had an inverted yield curve in 2006. What would the yield curve look like without the Fed massively intervening? Is there a way to "normalize" the short-term rates that would give us a proxy for short-term rates without active Fed intervention? Would it matter? If you have any thoughts on that topic, feel free to share.
LA, Vancouver, San Francisco, and a First
Often Wrong, Seldom in Doubt
I am off to LA tomorrow with son-in-law Ryan to meet with the team at Fahrenheit Studios that is helping us design the new websites. Then home for ten days, and then it's some much-needed vacation time with the family (kids and spouses and grandbabies - a total of 12 of us), to Italy.
I will be speaking at the Agora Financial Investment Symposium in Vancouver July 20-23rd. There are some really great speakers and this is a fun crowd. I got them to knock off $200 for my readers if you use the link and order form below. You can find a link to the list of speakers a little ways into the link. Hope to see you there!
http://agorafinancial.com/reports/vancouver/2010/vancouver2010_2.php?pub=C2010AFVAN&code=E400L5NC
I will also be speaking at the San Francisco Money Show August 19-21. I will have more on that show in the coming weeks, and links for registration.
And a big thanks to Greg Buoncontri and his team at Pitney Bowes. I spoke there last Wednesday and was made to feel quite special. It was a very upbeat conference with great speakers on how the world is changing. I learned a lot.
Finally, after ten years of writing this letter, I had a first tonight. At 9:30 I realized what I was writing was just not ready for prime time. You can't take the cake out of the oven until it is fully baked. I have had some half-baked ideas before, but never knowingly. As I say, I am often wrong but seldom in doubt. I really thought I knew where I was going, but the longer I thought and the more I wrote the more I kept disagreeing with myself. I still think there is some meat in the topic, but I need to think some more on it. You, gentle reader, deserve nothing less. I take this letter seriously.
I had to stop, pour myself some scotch, take a deep breath, and start over with a brand new topic. And since I haven't written about Fed policy for some time, a letter on it was due. It is now 1 AM and past time to hit the send button. Let's hope this doesn't happen for another ten years.
Your ready to begin to slow down (at least for tonight) analyst,
By John Mauldin
John Mauldin, Best-Selling author and recognized financial expert, is also editor of the free Thoughts From the Frontline that goes to over 1 million readers each week. For more information on John or his FREE weekly economic letter go to: http://www.frontlinethoughts.com/learnmore
To subscribe to John Mauldin's E-Letter please click here:http://www.frontlinethoughts.com/subscribe.asp
Copyright 2010 John Mauldin. All Rights Reserved
John Mauldin is president of Millennium Wave Advisors, LLC, a registered investment advisor. All material presented herein is believed to be reliable but we cannot attest to its accuracy. Investment recommendations may change and readers are urged to check with their investment counselors before making any investment decisions. Opinions expressed in these reports may change without prior notice. John Mauldin and/or the staff at Millennium Wave Advisors, LLC may or may not have investments in any funds cited above. Mauldin can be reached at 800-829-7273.
Disclaimer PAST RESULTS ARE NOT INDICATIVE OF FUTURE RESULTS. THERE IS RISK OF LOSS AS WELL AS THE OPPORTUNITY FOR GAIN WHEN INVESTING IN MANAGED FUNDS. WHEN CONSIDERING ALTERNATIVE INVESTMENTS, INCLUDING HEDGE FUNDS, YOU SHOULD CONSIDER VARIOUS RISKS INCLUDING THE FACT THAT SOME PRODUCTS: OFTEN ENGAGE IN LEVERAGING AND OTHER SPECULATIVE INVESTMENT PRACTICES THAT MAY INCREASE THE RISK OF INVESTMENT LOSS, CAN BE ILLIQUID, ARE NOT REQUIRED TO PROVIDE PERIODIC PRICING OR VALUATION INFORMATION TO INVESTORS, MAY INVOLVE COMPLEX TAX STRUCTURES AND DELAYS IN DISTRIBUTING IMPORTANT TAX INFORMATION, ARE NOT SUBJECT TO THE SAME REGULATORY REQUIREMENTS AS MUTUAL FUNDS, OFTEN CHARGE HIGH FEES, AND IN MANY CASES THE UNDERLYING INVESTMENTS ARE NOT TRANSPARENT AND ARE KNOWN ONLY TO THE INVESTMENT MANAGER.
John Mauldin Archive |
© 2005-2022 http://www.MarketOracle.co.uk - The Market Oracle is a FREE Daily Financial Markets Analysis & Forecasting online publication.