The Wilshire 5000 Stock Market Index Revisited
Stock-Markets / US Stock Markets Sep 01, 2007 - 12:55 PM GMTBy: Joseph_Russo
Perceptions from May of 2007:
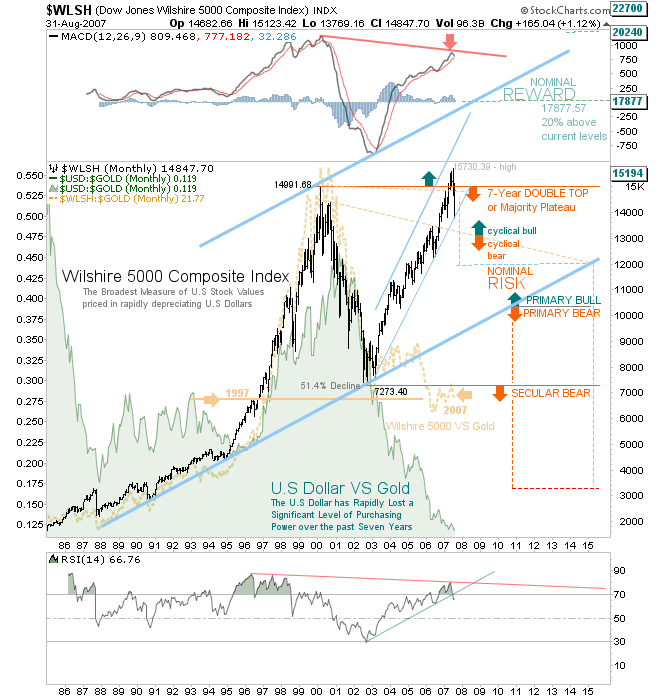
Four months ago, we presented Bullish: Like There's No Tomorrow , which presented a bullish view and critical-mass-breakout buying opportunity for long term-investors interested in capturing further upside potential in the Wilshire 5000 index.
We don't get fooled again:
Those adhering to the general protocols outlined in that piece are flat - as they now hold this index sternly to task - awaiting a long-side re-entry signal upon a close back above the 14991.68 level.
Going Forward:
All now rests upon the success or failure of more pie-in-the-sky interventions designed to abate a yet to be quantified risk, which now permeates through the financial-sphere with the threat of a terminal cancer.
Investors:
Adopting prudent long-term measures of austerity as outlined in our Wilshire 5000 link from May - is essential to successful investing, and is the type of guidance regularly highlighted in our longer-term studies.
Traders:
Those navigating in and out of broad market indices seeking short-term speculative profits will continue to do well in strictly adhering to the price-action, which if interpreted properly, telegraphs the markets short-term intentions with stunning accuracy - as evidenced in our chart below.
Below is an actual price chart, which will appear in the “Outlook” for Tuesday 9-4-07 :
The chart below documents standing short-term trade-triggers and price-targets as captured from Elliott Wave Technology's Near Term Outlook .
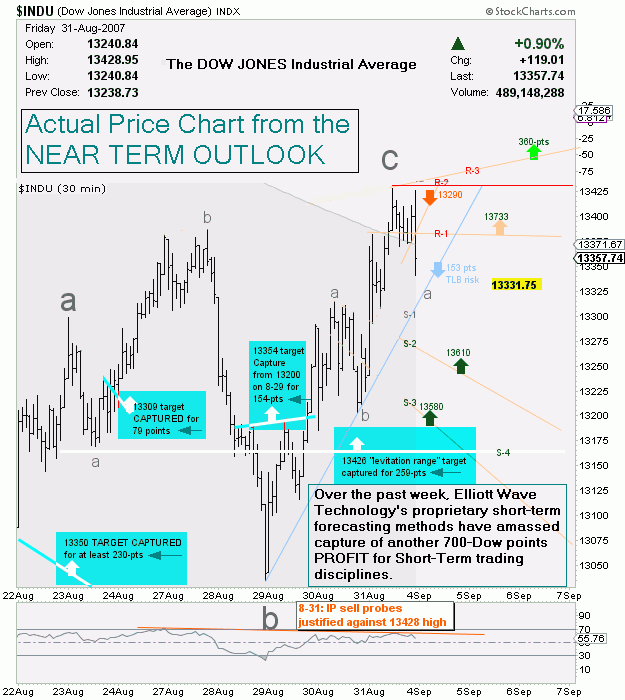
For active traders of all time-horizons, there is no better road map for navigating broad market indices than the Near Term Outlook .
The Week in Review:
The NASDAQ 100
The NDX:
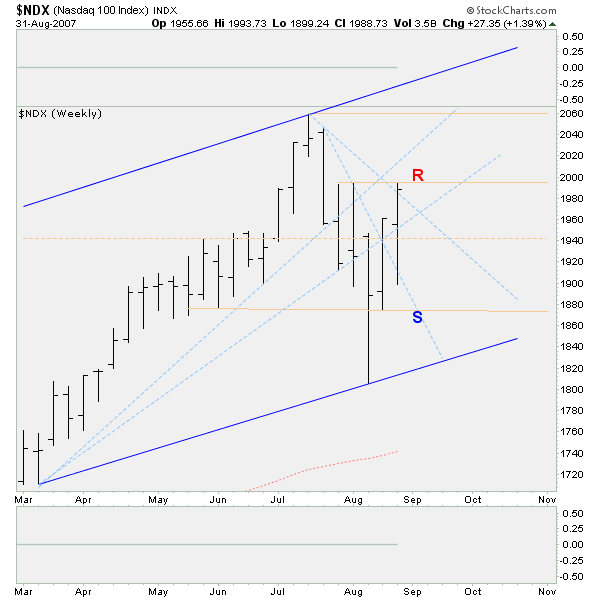
Up against resistance in its eighth-week of correction, fresh highs into the coming week may prove bearish, while an immediate sell-off to re-test the lows will likely turn the NDX more bullish near term.
That said; let's see how the balance of broad market indices' faired in closing out the month of August:
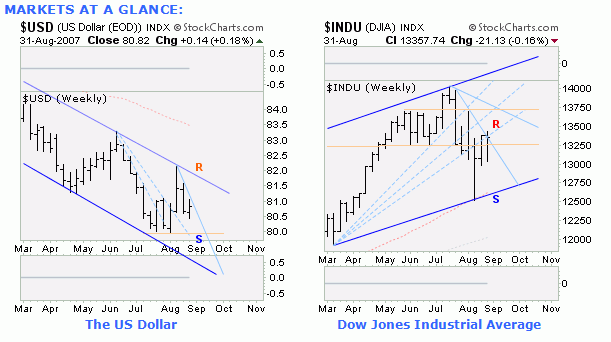
As the financial-sphere attempts to quantify known-risks vs pending interventions, it is likely that The Dollar remain under pressure for the next couple of weeks.
The Dow has managed a respectable bounce off the lows, but remains at the lower end of its former range from May/June.
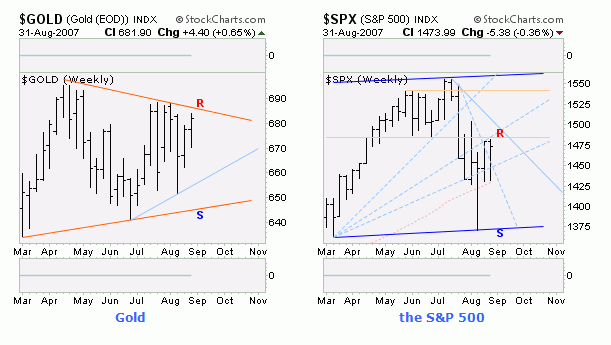
Gold continues to chomp at the bit in its quest toward breaking decisively above the large overhead triangle boundary of resistance.
Unlike the Dow, The S&P has been unsuccessful in reclaiming the lower end of it former May/June range.
Should readers have interest in obtaining access to Elliott Wave Technology's blog-page, kindly forward the author your e-mail address for private invitation.
For the first week in September, readers may visit our blog @ http://elliottwavetechnology.blogspot.com/ with out the need to request invitation.
Visitors to the blog are encouraged to browse all of the page-archives to acquire a better sense of our unique brand of analysis and forecasting services.
Until next time …
Trade Better / Invest Smarter...
By Joseph Russo
Chief Editor and Technical Analyst
Elliott Wave Technology
Copyright © 2007 Elliott Wave Technology. All Rights Reserved.
Joseph Russo, presently the Publisher and Chief Market analyst for Elliott Wave Technology, has been studying Elliott Wave Theory, and the Technical Analysis of Financial Markets since 1991 and currently maintains active member status in the "Market Technicians Association." Joe continues to expand his body of knowledge through the MTA's accredited CMT program.
Joseph Russo Archive |
© 2005-2022 http://www.MarketOracle.co.uk - The Market Oracle is a FREE Daily Financial Markets Analysis & Forecasting online publication.


