Stock Market Head and Shoulder’s? Where's Your Money?
Companies / Company Chart Analysis Jun 23, 2010 - 02:39 AM GMTBy: JD_Rosendahl
 The DOW trades lower today. I’ve been waiting for the market to at least consolidate, and we’ve seen the beginning of that over that the past two days. The market failed at the 50 day MA yesterday, and closed below the 200 day MA today. The DOW closed at its lows for the day right at the 38% retracement level. Price has failed at a level that qualifies for a right shoulder of a head and shoulders pattern, and caution on the long side is warranted. See chart below:
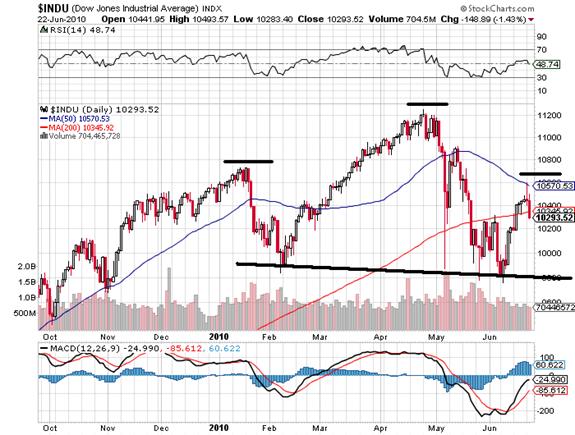
There’s still plenty of room and time for the DOW to trade back and forth and push into one more little advance and create a topping pattern for the right shoulder. I kind of like or favor this to occur. A close below 10,100ish probably negates that view.
From My Trading Desk:
The Longs:
We’ve been following 5 stocks (CAT, CSX, COH, UNP, UTX). We’ve traded them long recently, but we haven’t had an open long position on them for a few days. We still hold the view of waiting to see low risk set ups. That has turned out to be a smart strategy for low risk trading.
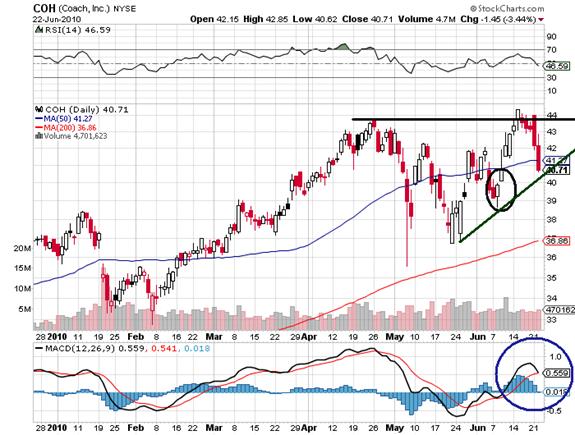
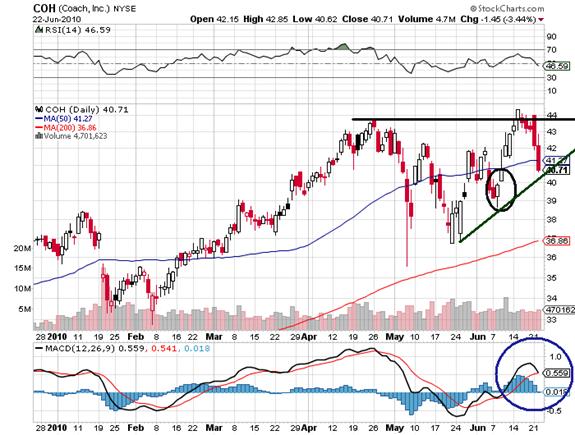
COH: The stock has rolled over. I thought the stock might make a flag or handle pattern from its recent high, and the first 3 days of the decline it looked like we were going to get just that. Patience paid because the past two days it has fallen sharply. While it still could push into one more high, it actually looks like a possible short.
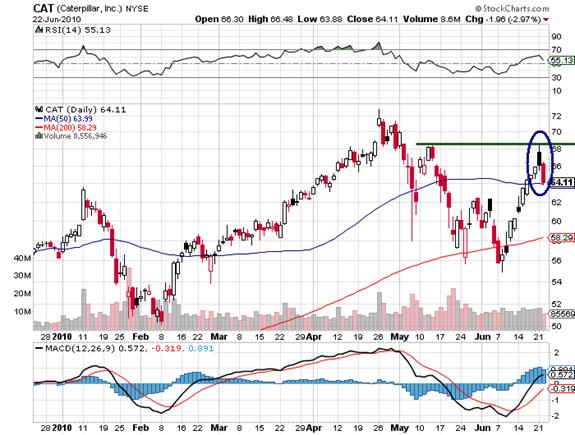
CAT: The stock failed yesterday at resistance, and looks like it has formed an Evening Star.
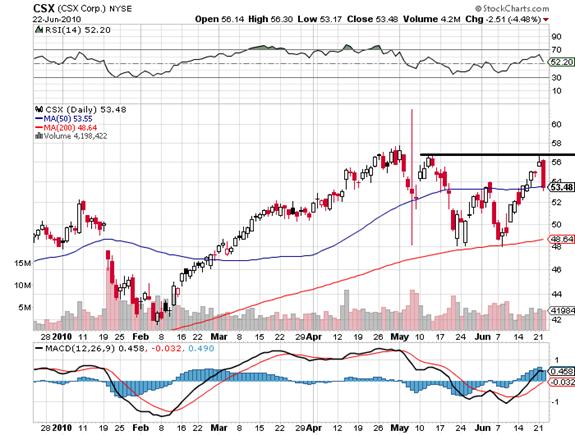
CSX: Also failed at resistance. It too has an Evening Star.
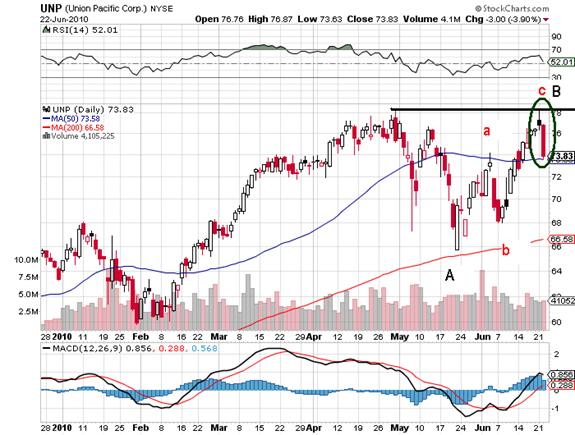
UNP: failed at prior high with an Evening Star. I’ve label what could be an ABC flat pattern just for show. I’m by no means trading that, but just wanted highlight a potential Elliott Wave Flat pattern.
UTX: Evening Star.
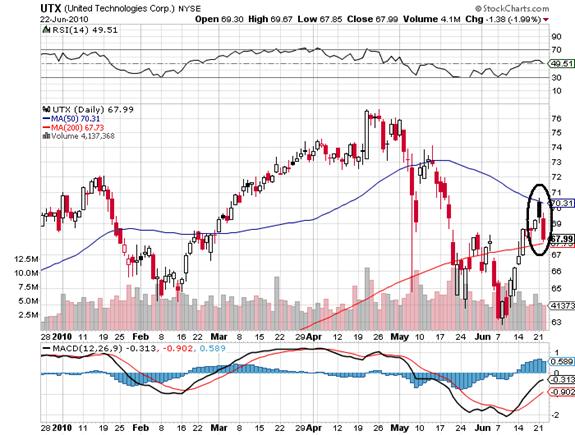
In the long side charts, we need more time to see if these stocks form flags or handles to initiate long trades. It’s just too early for low risk trading.
We have to be cautious as conservative traders from the long side because we don’t know if the recent stock market weakness is a pull back into wave 2 or B, or a failure into a right shoulder of a potential H&S pattern. Mr. Market likes to keep participants guessing. It won’t take long to know.
The Shorts:
We still carry our shorts as I believe the market will soon fail, and the head and shoulders pattern will be real. You could say, “I have a bearish bias longer term”. I expect the stock markets to begin discounting negative data (head winds) coming our way by year end or in 2011. As always though, we focus on the technical analysis for trading.
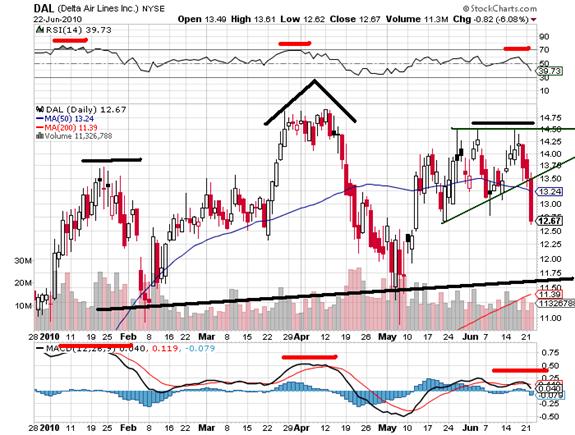
DAL: I highlighted a potential H&S pattern several days ago, and the stock has broken down substantially today. We have a half position short the stock, and are comfortable with that trade. We also have solid bearish divergences both the MACD and RSI. AND, we have a 3 Black Crows candlestick pattern.
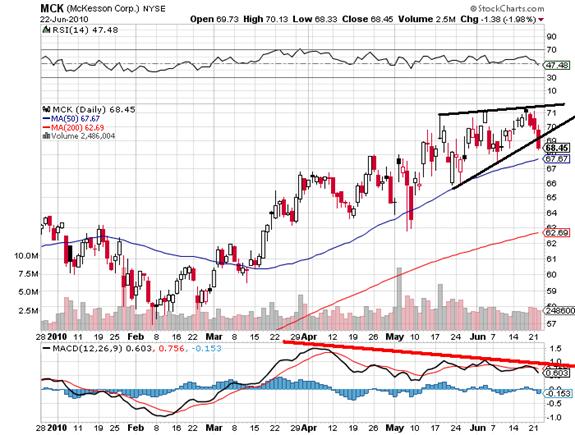
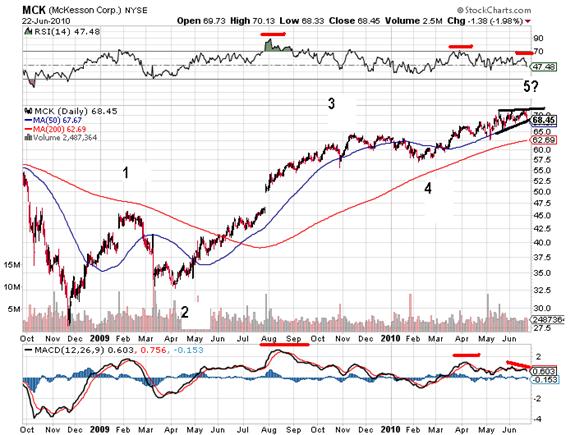
MCK: From my last update on our shorts, the stock has pushed into one more minor wave up, and might have complete wave 5 up with an ending diagonal. We carry a full position short MCK.
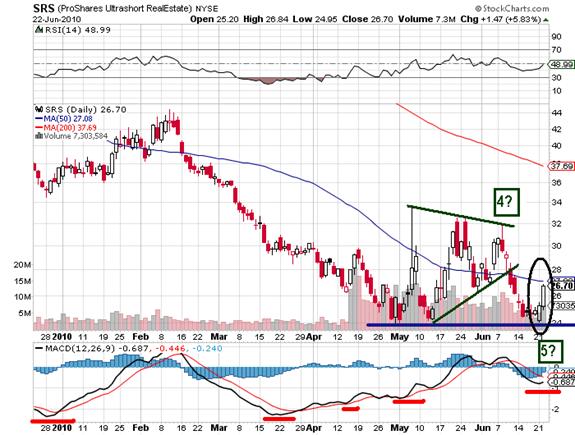
SRS: I opened a 1/3 of a position on SRS today. The short real estate ETF looks to have formed a double bottom after making what looks like a wave 4 wedge pattern and wave 5 down. I like the MACD structure and today seemed like a good time to dip our toe into the waters.
COH: We have bearish divergences forming on the MACD on a very minor new high. Yes, we took a half position on the short side. We need more technical damage to the down side to increase that position. If it closes below the up trend line and the gap in price, we have more significant price damage.
I’ll be the first one to admit, I’m more aggressive on the short or bearish side. If I’m wrong, we’ll know in the next few days or couple weeks, and as a trader we’ll have to deal with it in some manner. That’s trading!
Note: Shorting is not for everyone. It’s an aggressive trading strategy that just doesn’t fit the risk profiles of most investors.
Lastly, based on the price structure of the market, now is a great time for those who have buy and hold positions on the long side of the market to take some chips off the table to protect your net worth. You might want to consider exiting all together or averaging out.
It’s not about what actually happens, but focusing on the risk in the market. The risk is too great to be holding long term positions, and we have to manage risk first. Even if the market makes another new high, which I doubt highly, I believe the stock market will be significantly lower this time next year.
Hope all is well.
By J.D. Rosendahl
www.roseysoutlook.blogspot.com
J.D. Rosendahl was a former stock broker/investment consultant (currently not licensed) before becoming a Commercial Banker for the past 14 years. He manages his family's wealth, helping them avoid the high tech bubble and the real estate bubble melt downs and preserving wealth.
© 2010 Copyright J.D. Rosendahl - All Rights Reserved
Disclaimer: The above is a matter of opinion provided for general information purposes only and is not intended as investment advice. Information and analysis above are derived from sources and utilising methods believed to be reliable, but we cannot accept responsibility for any losses you may incur as a result of this analysis. Individuals should consult with their personal financial advisors.
© 2005-2022 http://www.MarketOracle.co.uk - The Market Oracle is a FREE Daily Financial Markets Analysis & Forecasting online publication.


