Gold Price Manipulation Prior to Options Expiration Exposed
Commodities / Market Manipulation Jun 28, 2010 - 02:45 PM GMTBy: Jason_Hamlin
 Gold futures expire today, June 28th. If you follow the manipulation theories, it is just prior to expiration time, either in futures or options, that paper shorts increase their net short positions in order to manipulate precious metals (and stocks) downward. This allows the manipulators to profit as the contracts they sold to unwitting investors expire worthless. The sudden drop in price also provides an opportunity for the shorts to cover their positions, profiting via paying back their creditors with lower priced gold or equities.
Investment banks and savvy traders riding their coattails have used this pattern to profit at the expense of honest traders that aren’t in the loop, as was detailed in the precious metals market by whistle-blower Andrew Maguire in March of this year. And despite the manipulation being meticulously explained to the Commodities Futures Trading Commission (CFTC) and released to the press by the Gold Anti-Trust Action Committee (GATA), nothing has been done to stop the manipulation or address the massive concentration of paper short positions by a few of the largest investment banks. But schemes of this nature tend to eventually fall apart one way or another, even if market regulators are bought off and completely lacking in the moral integrity necessary to do the right thing. Market forces have a way of re-asserting themselves, particularly when the scam is brought into the light.
In order to fact check some of Andrew Maguire’s claims and try to identify new trading opportunities, I decided to take a look at gold’s price action just prior to futures and options expiration since the start of the year to see if the charts (courtesy of Kitco) support the claims of manipulation.
Expiration Dates (CME Metals Calendar):
Gold Futures – The third to last business day of each delivery month is the last trading day (LTD).
Gold Options – The fourth business day prior to the first calendar day of the corresponding Gold futures delivery month.
Stock Options – The third Friday of the expiration month.
January 15 – Stock Options Expiration
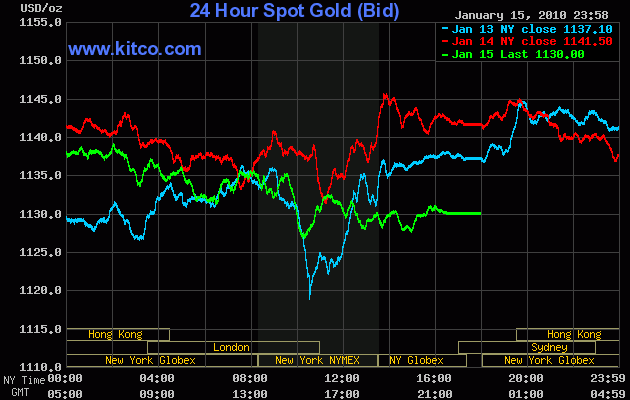
Gold was trading above $1,150 on the January 12th (not shown on chart), but dropped $20 in the two days prior to options expiration. The $8 decline on options expiration Friday (green line) is pretty mild compared to the upcoming charts.
January 26 – Gold Options Expiration / January 27 – Gold Futures Expiration
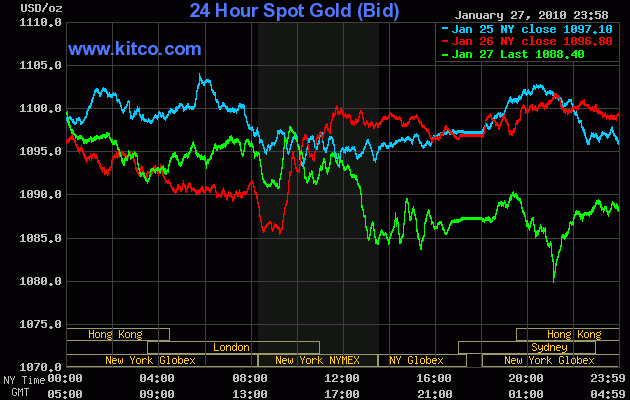
Despite signs of investors once again buying the dip, gold was held below the key $1,100 level until after options expiration, closely the day at $1,099.40 (red line). Gold declined another $12 on futures expiration day (green line).
February 19 – Stock Options Expiration
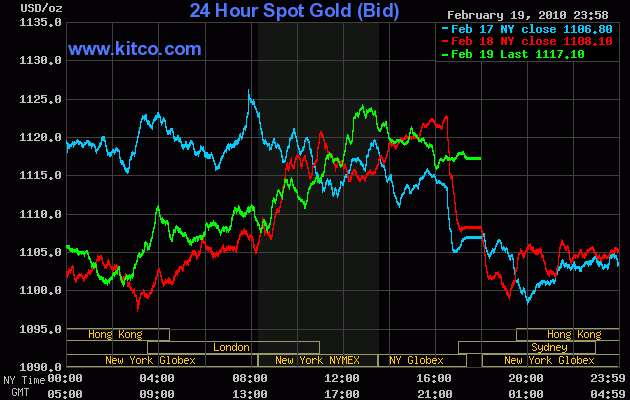
Here we witness a 3-day roller-coaster ride leading up to stock options expiration in February. Gold dropped sharply $25 on the 17th, rebounded $25 on the 18th, before losing all of that gain again in the morning hours. Bulls look to have prevailed this time as gold advanced on options expiration Friday. Still, the price action suggests a fierce battle going on between buyers and sellers with huge price swings far exceeding typical daily volatility.
Feb 23 – Gold Options Expiration / Feb 24 – Gold Futures Expiration (LTD)
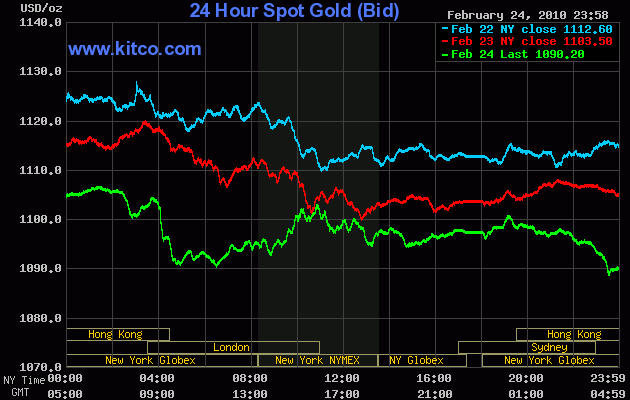
Again, we have two days of declines leading up to futures expiration day for gold. Notice how the price action was nearly identical during the two final days before expiration. Another $30 drop in 3 days with all of the action occurring during NYMEX trading hours.
March 19 – Stock Options Expiration
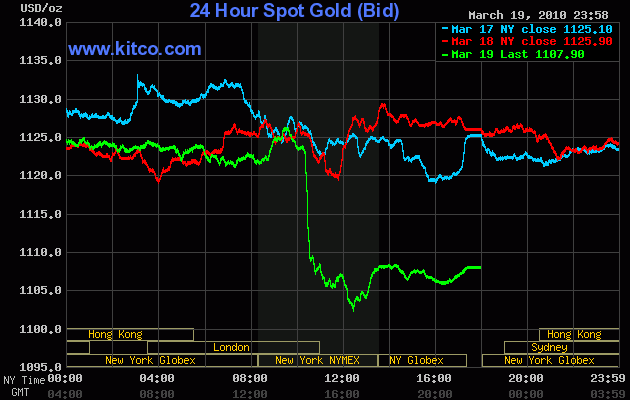
Gold lost another $30 in the 3 days prior to options expiration, including a vertical plunge of over $20 within just a few hours on options expiration Friday (green line). Coincidence perhaps, but certainly peculiar timing for the largest single-day decline during the month.
March 25 – Gold Options Expiration / March 29 – Gold Futures Expiration (LTD)
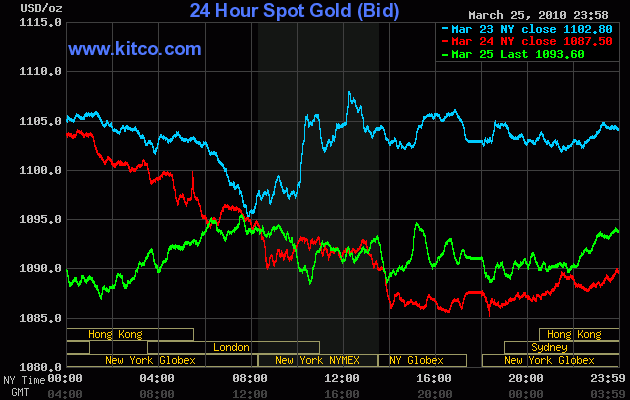
Gold was again pulled down (red line) and held below $1,100 (green line) for gold options expiration.
April 16 – Stock Options Expiration
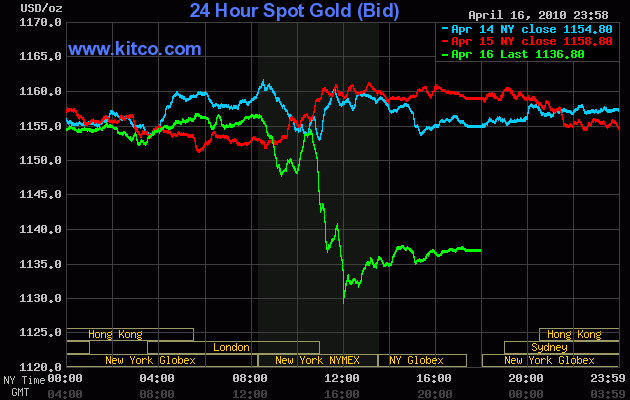
Another $25 free fall shortly after 10am during New York trading. Surprise surprise. Noticing a trend yet?
April 27 – Gold Options Expiration / April 28 – Gold Futures Expiration (LTD)
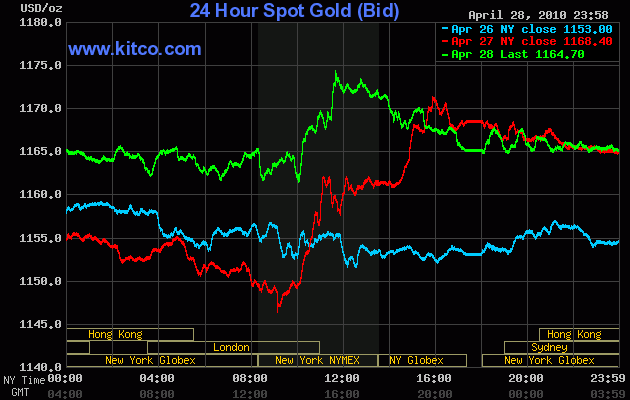
Finally a month where the gold price advanced into futures expiration. It looked as if the gold price was about to decline on the 27th (red line), but it instead pushed $20 higher. This was also the first futures expiration after whistle-blower Andrew Maguire exposed the fraud. One could reasonably speculate that certain investment banks might have decided to back off their manipulation following the highly publicized CFTC hearing.
May 21 – Stock Options Expiration
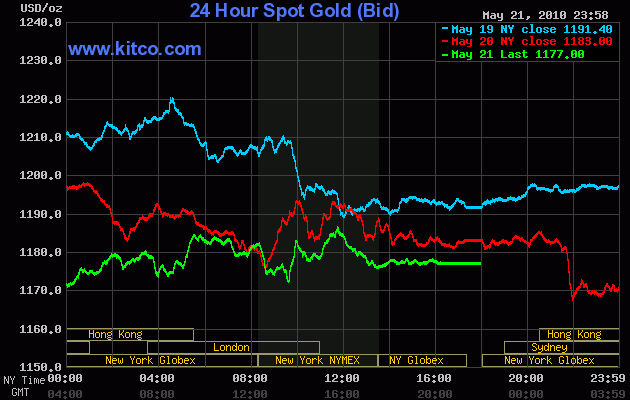
Gold declined from a high of $1,220 on May 19th to just $1,177 on May 21st. That is a massive drop of $43 in just three days leading up to stock options expiration.
May 25 – Gold Options Expiration / May 26 – Gold Futures Expiration (LTD)
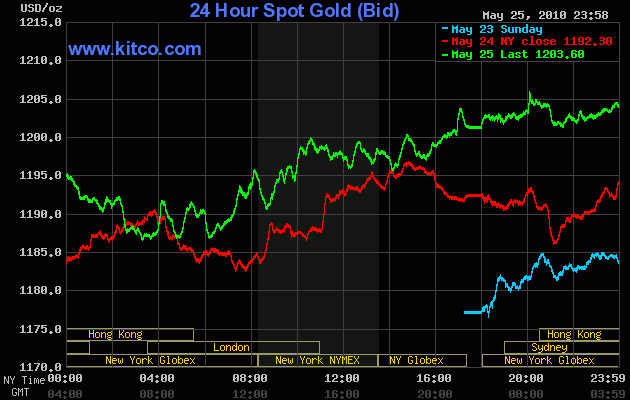
With gold already having been whacked by $43 in prior days, the objective leading up to futures options expiration seems to have been to keep the gold price under the $1,200 mark until the close of trading. Success! And within hours of futures options expiration, gold pushed through the $1,200 level and climbed to nearly $1,220.
June 18 – Stock Options Expiration
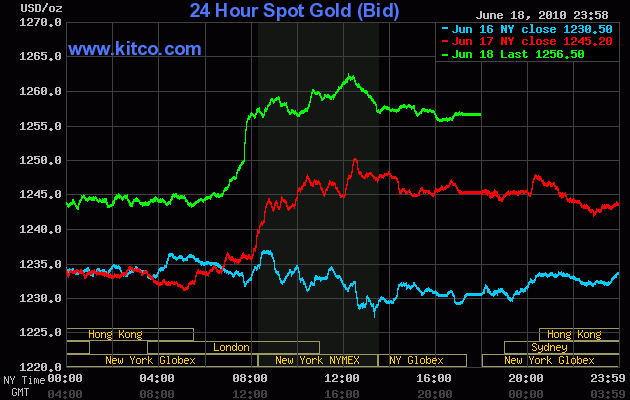
June marks the first month since the roller-coaster battle in February that gold did not suffer a sharp decline leading up to stock options expiration.
June 24 – Gold Options Expiration
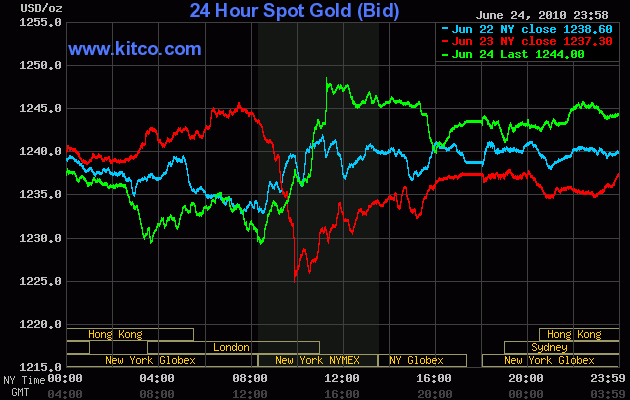
It certainly appears that a take down of the gold price was attempted the day prior to gold options expiration (red line). But gold bounced back, buyers appeared and the gold price actually advanced modestly on the day of gold options expiration (green line), although the price was still held below $1,250 for expiration. I broke out this month’s futures expiration into a separate chart below.
June 28 – Gold Futures Expiration (LTD)
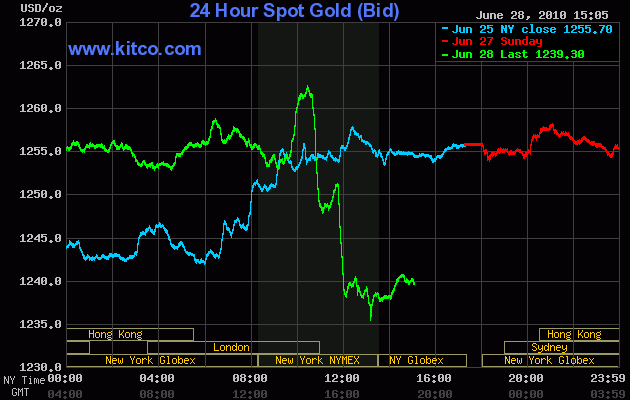
Ouch! On the last trading day for June futures, the price dropped by more than $25 in just two hours on NYMEX trading. Buyers appeared below $1,250 and again below $1,240, but the selling pressure was overwhelming.
Summary
The extreme concentration of paper short positions by 4 or fewer banks is certainly fishy and the charts above appear to support the manipulation claims of Andrew Maguire, GATA, Ted Butler, Jason Hommel and others. In the days leading up to expiration of gold futures and options, the gold price has routinely started to behave oddly and almost always managed to drop sharply prior to expiration.
As a trader, you can utilize the trend documented above in order to seek short-term trading opportunities. As a long-term investor, you should realize that the sharp sell-offs in precious metals just prior to expiration dates are likely manufactured and almost always short-lived. Therefore, don’t be a panic seller and play into their game. If you believe in the fundamentals and long-term prospects for gold, clutch your precious metals with strong hands and don’t let your emotions force you to sell at the wrong times. You will invariably have to buy back at higher prices, incur additional trading fees and create high levels of undue stress in the process. Remember, gold is nowhere near its inflation-adjusted high ($2,300 – $7,000 depending on the inflation numbers used) and has another 5-10 years compared to the duration of most historic bull markets.
The bottom line is that the manipulation (if it exists) can not be sustained for the long term. China, Russia, Iran, India, central banks and savvy investors around the world are buying up as much physical gold and silver as they can. The dips, whether manufactured or not, are being met with increasingly strong buying demand. Government and individuals are rightfully diversifying out of fiat paper assets and as big money begins to move into a relatively small precious metals market, demand is likely to overwhelm supply and push prices much higher. Stay the course and see the dips for what they truly are – buying opportunities.
By Jason Hamlin
Gold Stock Bull Premium Membership - If you would like to receive my monthly contrarian newsletter, view the Gold Stock Bull portfolio and receive email alerts whenever I am buying or selling, become a premium member today. You can try it out monthly at just $35 and cancel at anytime if you aren’t 100% satisfied. View the video introduction for more details or click here to get started now!
All ideas, opinions, and/or forecasts, expressed or implied herein, are for informational purposes only and should not be construed as a recommendation to invest, trade, and/or speculate in the markets. Any investments, trades, and/or speculations made in light of the ideas, opinions, and/or forecasts, expressed or implied herein, are committed at your own risk, financial or otherwise. The information on this site has been prepared without regard to any particular investor’s investment objectives, financial situation, and needs. Accordingly, investors should not act on any information on this site without obtaining specific advice from their financial advisor. Past performance is no guarantee of future results.
© 2005-2022 http://www.MarketOracle.co.uk - The Market Oracle is a FREE Daily Financial Markets Analysis & Forecasting online publication.


