


U.S. Housing Bear Market Second Down Leg Closer Look
Housing-Market / US Housing Jun 29, 2010 - 03:38 AM GMTBy: John_Mauldin

 Quickly, I will be on Larry Kudlow's show tonight (Tuesday, June 28), which is at 7 pm Eastern. Larry has promised that we will spend some quality time on some of the current issues facing us. See you there! And now, let's jump in to this week's Outside the Box.
Last January 2009, the Outside the Box featured FusionIQ's quant models that blend both fundamental and technical metrics to determine the strength of 8,000 equities as well as the overall markets ( Trading With the Big Boys).
You may recall that CEO Barry Ritholtz, (and good friend and Maine fishing buddy) had been bearish throughout 2008, and was still negative on stocks back in January 2009. Relying mostly on the FusionIQ metrics, Ritholtz flipped bullish on March 2009, and stayed bullish the rest of the year. The firm began raising cash in Q1 of 2010, and by the time the first quarter was over, was only 50% long. They sold more stock in April, and in a bit of good timing that Ritholtz will tell you was "dumb lucky" went to 100% cash on May 5, 2010 – the day before the 1,000 point flash crash.
Some economists see the world from a 30,000 foot overview (that would be me); other analysts work bottoms up. The quants – mathematical analysts whose world view consists of granular data –crunch numbers to reveal what it may about markets and economies. Ritholtz is one of the few that combines all three. This has led to prescient economic and market calls that made his clients and readers money, and kept them out of harm's way when things got ugly. Indeed, Dow Jones noted that "many market observers predict tops and bottoms, but few successfully get their timing right. Jeremy Grantham and Barry Ritholtz sit in the latter category. . ." heady company indeed.
Regarding the market calls, Ritholtz said "We cheat. We use everything that we know works. Macro economics, technicals, fundamentals, valuation, quantitative – it all goes into the mix. That's our secret sauce." Ritholtz added "I don't know why other people limit themselves to just one discipline – the value guys never look at technicals, the fundamental analysts ignore macro cycles. It creates blind spots in their analyses. When we go over other research reports, they are obvious to see."
I have been intrigued by the Fusion system's ability to warn investors to get out of the way of dangerous stocks sectors, even the entire market – before trouble hit.
Dumb lucky or not, I have found over the last year and a half, looking over Barry's shoulder, that this system does seem to (in general) give some very interesting signals about the market. I wanted to catch up with Barry to see what the FusionIQ system was saying these days – about Energy Stocks, about Housing and anything else that he thought noteworthy. As you can imagine if you know Barry, I got an opinionated earful. (Barry is like me, often wrong, but seldom in doubt.) I asked him to put it in a letter for this week's Outside the Box.
What follows is his explanation as to why Housing fall still has further to fall. He included some charts that explain what stocks and sectors to look at and avoid.
His application of both the macro and micro views, combined with using FusionIQ "to cheat," as he puts it, is why institutions and high net worth individuals seek out the firm's investment advice.
As is my custom, I will give you a link to where you can find out more about their services. Visit their site to learn more about FusionIQ. Watch their demo. Outside the Box subscribers are eligible for a discounted rate (less 20%) on the monthly subscription. http://www.fusioniqrank.com/signup.php?a=1
One caveat. This system is for serious traders. Most of you shouldn't be trading. It takes discipline and time. That is not a knock on anyone. I don't trade or have any business trading, either. A man's got to know his limitations. So I find what Barry writes about below interesting and informative. But some few of you who trade should explore his system as another arrow in your quiver.
Your writing away on his book analyst,
John Mauldin
Editor, Outside the Box
A Closer Look at the Second Leg Down in Housing
Our story so far:
Following the 2000-03 DotCom crash, then Fed Chair Alan Greenspan brought Fed Funds rates down to ultra-low levels. Under 2% for 3 years, and at 1% for more than a year.
Rates this low - and for that long - were simply unprecedented. They wreaked havoc with the traditional fixed income market. Bond managers were forced to scramble for yield; they found it in investment grade, triple-A rated residential mortgage-backed securities (RMBS). The higher yield was created by securitizing mortgages, using an unhealthy slug of riskier, sub-prime mortgages.
The demand for RMBS paper was nearly insatiable. Wall Street sucked up as much sub-prime paper as could be legitimately, then illegitimately, produced. The Lend-to-securitize-nonbank mortgage writers responded to the demand by abdicating traditional lending standards. These firms handed out 30-year mortgages to people who in no conceivable way could afford to repay them. The mortgage underwriter's hope was for no default over the warranty period of the mortgage – typically, just 90 or 180 days. After that, the loans were Wall Street's problem.
The Greenspan Fed, in charge of supervising financial lending institutions, looked the other way.
The net result was a massive national credit bubble, and a housing boom. (A true housing bubble only formed in a handful of regions). The credit bubble allowed tens of millions of Americans to become, however temporarily, home-owners.
Consider: In 1992, some 4 million homes per year were being purchased. A decade later, that number had risen 25% to annual sales of five million. A mere three years later, annual sales were over 7 million units - a 40% increase.
From 2002 to 2007, the abdication of lending standards - who cares about credit scores, incomes, debt load, assets, even a job! - helped to create millions of new homeowners. And thanks to the ultra low rates, prices had exploded. The combination of new, unsophisticated buyers and rapidly rising prices was a dangerous combination.
Buyers of limited financial means – who en masse overpaid for their houses at historically low rates – were recipes for disaster. As the Fed began its cyclical tightening, price appreciation slowed, than reversed. As sales plummeted, prices fell. Since 2006, five million of those buyers were foreclosed upon, with another 4-5 million likely to come.
Which more or less brings you up to date.
Today, residential real estate confronts numerous headwinds: Credit, once given to anyone who could fog a mirror, is now tight. Today, demand is far below what it was during most of the past decade. Home prices are still unwinding from artificially high levels, and remain over-priced. Inventory is elevated. A huge supply of shadow inventory is out there: Speculators and flippers who overpaid but have held onto their properties await modestly higher prices to sell. Bank owned real estate (REOs) continues to increase. That's before we get to the fact that unemployment remains high, and is unlikely to improve anytime soon. Oh, and wages have been flat for a decade.
This are not encouraging factors about housing.
This is known, or at least should be by those who have looked at the data. I cannot explain why some economists still have not figured this out.
In my analysis, price stands out as being the prime mover of the next leg down. High unemployment, and a decade of flat wages aren't helping to create any new housing demand. And the millions in homes they cannot afford will eventually add more pressure to inventory and prices. Indeed, we are still working
But the bottom line is Home prices remain too high: There can be no doubt that home prices have moved way down from the 2005-06 peaks. How did I reach the conclusion that, even after a 33% decrease in prices, home prices are high?
By using traditional metrics: Whether we are looking at US housing stock as a percentage of GDP or Median income versus home prices or even ownership versus renting costs, prices remain elevated. Indeed, we see prices remain above historic means.
Consider price relative to income. From 1977 to 2010, the median US home price was 4.1 times median household income. But as the chart below shows, Home prices are still above that mean. Oh, and that mean is artificially elevated due to the 2002-07 boom. It's the same with home prices relative to rentals, or housing value as percentage of GDP.
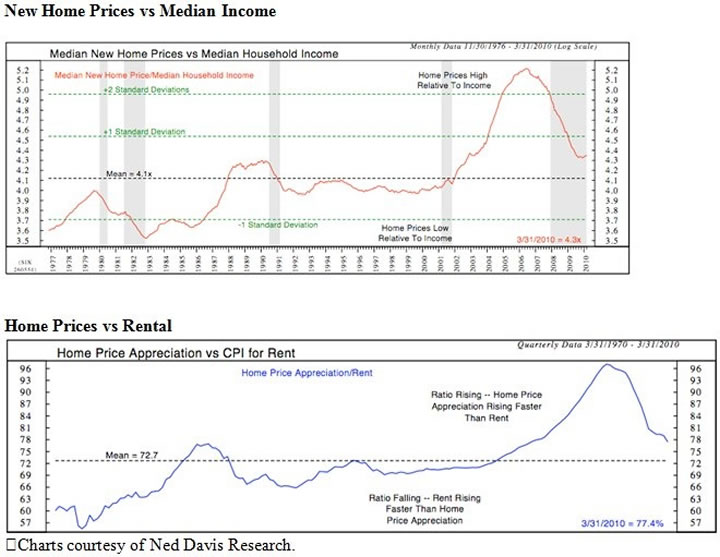
Further, we should not assume that prices merely mean revert back to historic levels. What usually happens when markets get wildly overvalued – and a ~3 standard deviation price move sure qualifies -- is they get resolved not by reverting to the mean, but by careening far beyond it.
We can look at numerous other factors. Employment, inventory, REOs, credit, another wave of foreclosures. etc. But the bottom line remains that prices must revert to a sustainable level, and we simply aren't there - yet.
Yes, government policies temporarily stopped prices from finding their natural levels. Now that the tax credit has ended, and most mortgage modifications are failing, the prior downtrend in price is likely to now resume.
Neither the Bush nor the Obama White House understood this. The assumption has been that if we can modify mortgages or voluntarily refrain from foreclosures, the residential RE market will stabilize. Through a combination of mortgage mods and buyers tax credits, the government has managed to create artificial demand and keep more supply off of the markets for a short time. But as we have seen, that fix was at best temporary.
One of the things that Markets are best at is price discovery - the determination of a price for a specific item through basic supply and demand factors. Without the heavy hand of the government intervening, the residential real estate market is about to experience what price discovery is all about . . .
~~~
Understanding this and applying it to trading are two different skill sets. That is why we prefer to rely on quantitative tools to help identify opportunities and problem areas before most people are aware of them – before they become front-page news.
The Fusion IQ system generates buy, sell and neutral signals based upon algorithms developed over many years. It is designed so that unemotional, objective criteria determine what is worth keeping or selling. We don't create these signals, the system does.
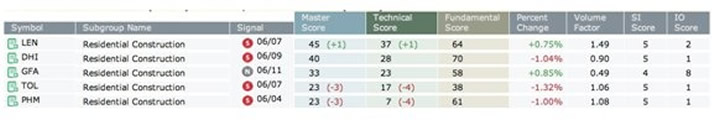
Let's put our Housing conversation above into some context. Consider from a Trader's perspective the opportunity for a downside trade in the Home Builders. Our quantitative rankings flashed a warning sign on the Residential Construction Group several weeks ago.
You can see the sector went to a Sell signal early in June:
As the charts below reveal, two of the major homebuilders look particularly weak: both Toll Brothers (TOL) and KB Homes (KBH) gave good tradable Sell signals some time ago that traders acted upon.
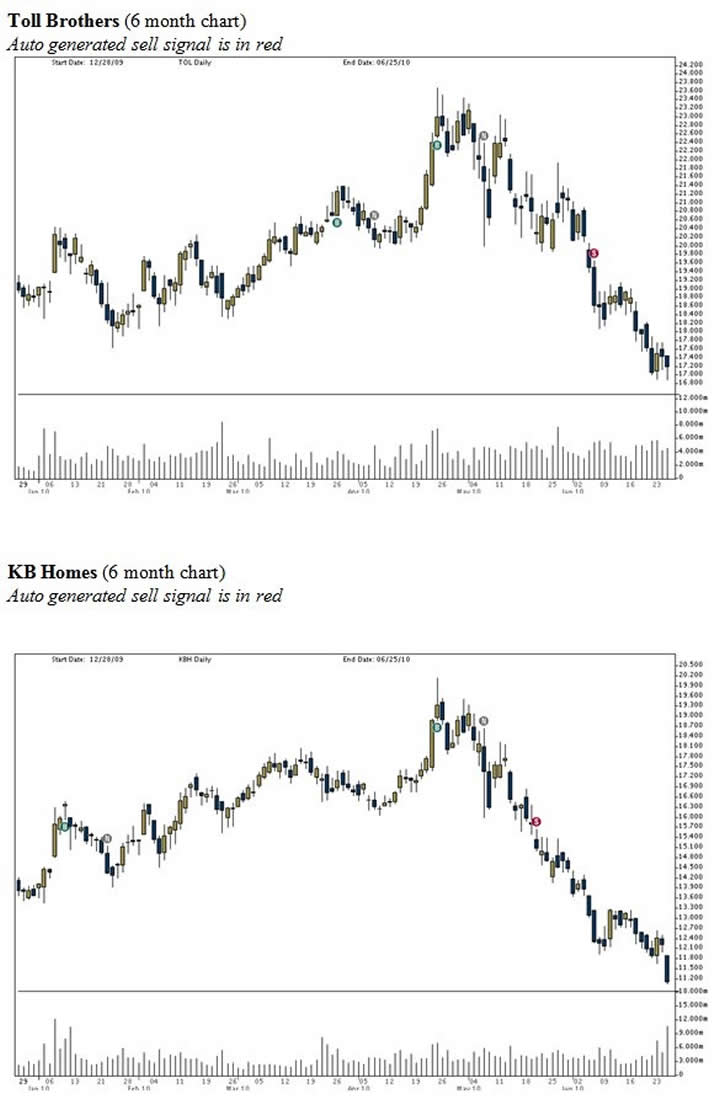
If you look at a long term chart of these two, they could revisit their lows from March 2009. That would be a huge round trip.
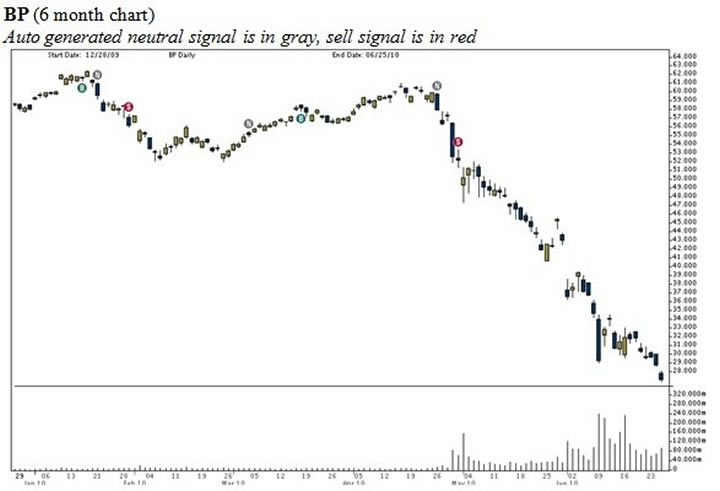
Let's look at another company that is in the News: BP. It flipped from a Buy to a Neutral in mid-April, around $59 dollars. On April 20, it went to a Sell Signal – at $52. Numerous clients have inquired about it. It is still on a sell signal, and we have advised clients to do no more than put a toe in the water. It is better to wait for more positive signals before jumping in with both feet. Wait for the stock to be above its 20 or 50 day moving average – or for a new Buy Signal to be issued.
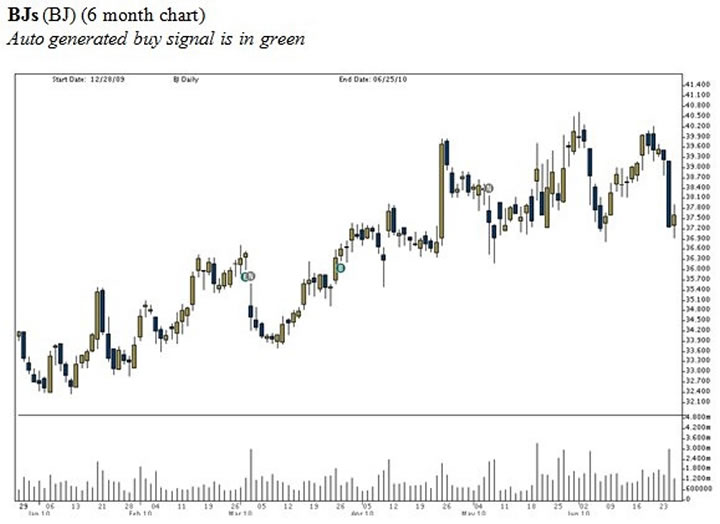
Retail stocks have been getting hammered lately. But BJs is holding up well. Think of it as the best house in a bad neighborhood. We bought some when it went to buy signal in march of this year. Despite the market pulling back, BJs is still holding up well. It is ranked 85 (out of a 100) and is currently on a neutral signal. (That means don't add to it, but don't sell it yet either).
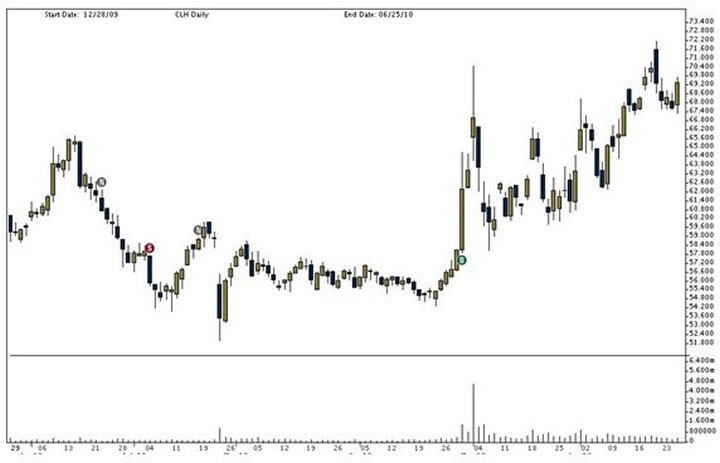
The flip side of the BP spill are companies that are needed to help clean up the Gulf of Mexico oil spill. Clean Harbors is one such firm. It went to a Buy Signal back on April 29, 2010 at about $57 dollars. The stock is now approaching $70, has a technical ranking of 94 out of 100, and is still on a Buy signal. (Note to traders -- CLH, which has a market cap of $1.8 billion dollars, has a 10 day average volume of 250k -- its not very liquid, so tread lightly).
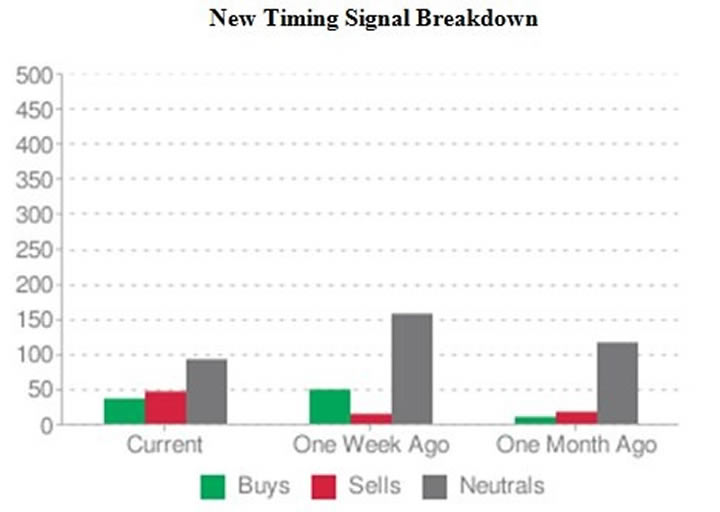
Lastly, let's look at our entire universe of stocks to see what we can learn about the recent changes in timing signals and score rankings.
The first chart below shows a modest number of Buy signals and increasing numbers of new Sell signals. However, both are dominated by Neutrals. Often, this is a sign of a range-bound market. That is reflected in the 75% cash position in our managed accounts.
The Technical scores tell a similar story. Three months ago, there were more than 4000 stocks ranked greater than 70 (out of a 100). That number has dropped to below 3,000. The lowest ranked group has ticked up from 2500 to just under 3000. This also reflects a modest balance, and has not reached any extremes.
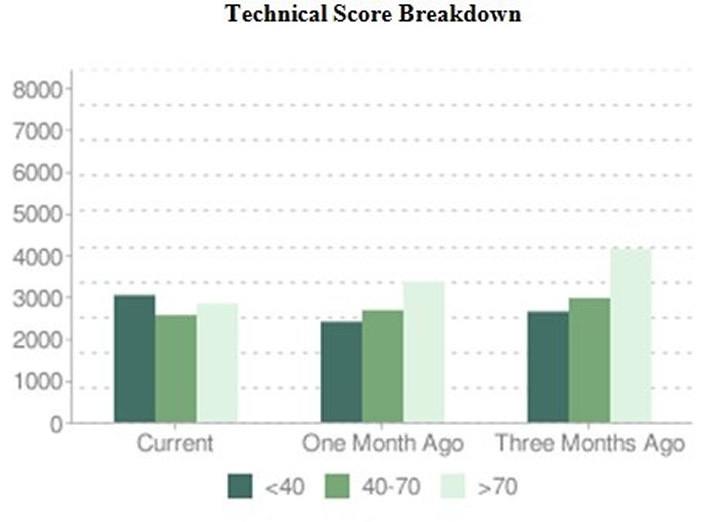
Both charts reflect a market lacking in direction and institutional conviction.
Until the picture clears up, we remain uncommitted, keeping a healthy amount of cash in our accounts. We advise readers do the same . . .
JM here. Have a great week!
By John Mauldin
John Mauldin, Best-Selling author and recognized financial expert, is also editor of the free Thoughts From the Frontline that goes to over 1 million readers each week. For more information on John or his FREE weekly economic letter go to: http://www.frontlinethoughts.com/learnmore
To subscribe to John Mauldin's E-Letter please click here:http://www.frontlinethoughts.com/subscribe.asp
Copyright 2010 John Mauldin. All Rights Reserved
John Mauldin is president of Millennium Wave Advisors, LLC, a registered investment advisor. All material presented herein is believed to be reliable but we cannot attest to its accuracy. Investment recommendations may change and readers are urged to check with their investment counselors before making any investment decisions. Opinions expressed in these reports may change without prior notice. John Mauldin and/or the staff at Millennium Wave Advisors, LLC may or may not have investments in any funds cited above. Mauldin can be reached at 800-829-7273.
Disclaimer PAST RESULTS ARE NOT INDICATIVE OF FUTURE RESULTS. THERE IS RISK OF LOSS AS WELL AS THE OPPORTUNITY FOR GAIN WHEN INVESTING IN MANAGED FUNDS. WHEN CONSIDERING ALTERNATIVE INVESTMENTS, INCLUDING HEDGE FUNDS, YOU SHOULD CONSIDER VARIOUS RISKS INCLUDING THE FACT THAT SOME PRODUCTS: OFTEN ENGAGE IN LEVERAGING AND OTHER SPECULATIVE INVESTMENT PRACTICES THAT MAY INCREASE THE RISK OF INVESTMENT LOSS, CAN BE ILLIQUID, ARE NOT REQUIRED TO PROVIDE PERIODIC PRICING OR VALUATION INFORMATION TO INVESTORS, MAY INVOLVE COMPLEX TAX STRUCTURES AND DELAYS IN DISTRIBUTING IMPORTANT TAX INFORMATION, ARE NOT SUBJECT TO THE SAME REGULATORY REQUIREMENTS AS MUTUAL FUNDS, OFTEN CHARGE HIGH FEES, AND IN MANY CASES THE UNDERLYING INVESTMENTS ARE NOT TRANSPARENT AND ARE KNOWN ONLY TO THE INVESTMENT MANAGER.
John Mauldin Archive |
© 2005-2022 http://www.MarketOracle.co.uk - The Market Oracle is a FREE Daily Financial Markets Analysis & Forecasting online publication.