


Stock Market SPX Breaks September Low as VIX Spikes
Stock-Markets / Stock Markets 2010 Jul 04, 2010 - 06:55 AM GMT

 FDIC Friday on vacation. - The FDIC Failed Bank List announced no new bank closures this week. FDIC employees took an extended holiday.
Stocks, Commodities Drop on Jobs, Factory Orders Data
U.S. stocks fell, with the Dow Jones Industrial Average extending its longest slide since the financial crisis of 2008, and commodities slumped as data on jobs and factory orders added to concern the economic rebound is slowing. The 10-year Treasury yield held below 3 percent.
The Dow slid for the seventh day, losing 46.05 points, or 0.5 percent, to 9,686.48 after earlier tumbling as much as 118 points. The Standard & Poor’s 500 Index slipped 0.5 percent to 1,022.58 at 4 p.m. in New York. Both closed at the lowest levels since at least October 2009.
Will Austerity Be The Catalyst For War?
(ZeroHedge) While the gist of the piece is presenting a comprehensive overview of the traditional and cognitive biases toward inflationary policies and away from hard, unpopular, deflationary/austere measures, Dylan provides a chilling anecdote involving the 1980s conflict between the UK and Argentina, in which it was precisely war that pulled an extremely unpopular government, that of Maggie Thatcher, out of the gutter of public opinion, and soaring in popularity.
The VIX rises back above its 13-week moving average.
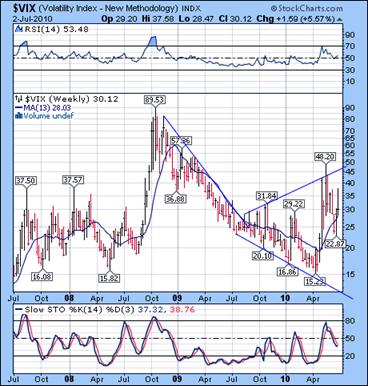 --The VIX rallied above its 13-week moving average at 28.03, and closed the week at a gain. The uptick in volatility has an interesting effect on the equities cycles. The normal cycle recedes and a longer cycle takes its place. This is not recognized by many cycle experts, since the relationship between volatility and the cycles has been largely ignored.
The NYSE (weekly) Hi-Lo index declined to -44, maintaining its position in the bearish camp. The percentage of stocks selling above their 50-day moving average declined to 7% this week, making a new low since March 2009.
The SPX declined below September lows.
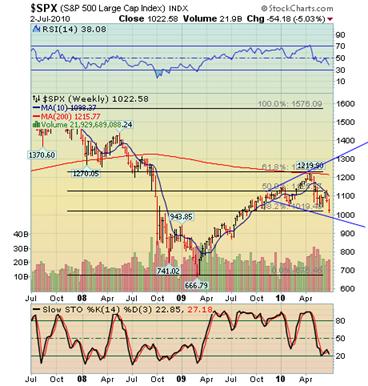 -- SPX fell below the Fibonacci retracement levels and the October 2009 lows. It now has a potential free-fall area to 869, the July 2009 low, as it works its way out of a congestion area that gives it its Head & Shoulders profile.
The Head & Shoulders and Broadening Top formation agrees with the above analysis, with a minimum target of 861. If the decline to 861-869 is wave i of (iii), then wave iii of (iii) should certainly take out the 666 low. Just speculating for now, but the possibilities of this decline are enormous.
The ramp job to get shorts to cover at the end of Friday’s trading session turned out to be a joke.
The NDX declined below its Broadening Wedge.
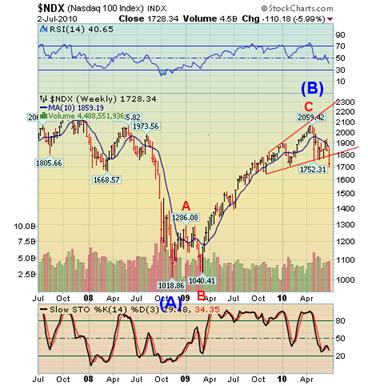 --The NDX has an ascending Broadening Wedge formation that also acts as a Head & Shoulders top. The trap door has clearly sprung in the Broadening Formation, which now calls for a decline to the mid-1400s. The July low is at 1395, which leads me to speculate whether this wave may extend to that level. This cycle is extremely left-translated, which leaves a longer period of decline than most can imagine. Market observers are so conditioned to longer rallies before the bear takes over. Wednesday is the next pivot, but I don’t expect a tradable bottom until Monday, July 12 at the earliest.
The Gold rally may have fizzled short of its potential targets.
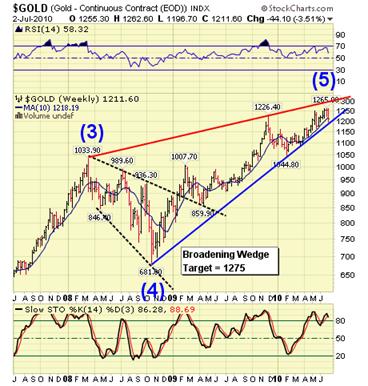 -- Gold made a valiant attempt at its Broadening Wedge target of 1275, but remained 10 points short of its goal after another week of trying. Let’s look again at last week’s commentary. “The Broadening Wedge target has an 81% probability of success. In addition, the upper trendline of the larger bearish wedge is at 1300, so it appears that it may be final resistance. But it does not have to reach it.”
On Thursday we had a short-term sell signal, which dropped gold below its 10-week moving average, but may not have violated its bearish Rising Wedge, yet. A drop below this week’s low at 1196 may confirm the bearish pattern.
$WTIC now appears ready to break its Broadening Top formation.
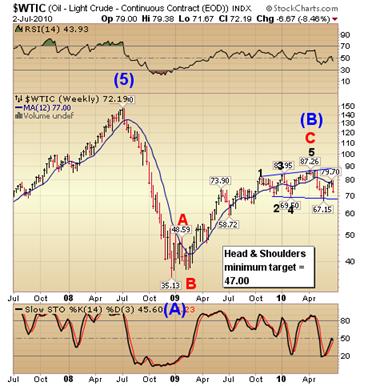 --$WTIC now has the opportunity to break through its Orthodox Broadening Top Formation and begin its largest impulse since the fall of 2008. Once it breaches its lower trendline, its Orthodox Broadening Top target is 52.00.
Using the lower B. T. trendline as a neckline of a complex Head & Shoulders pattern, we can derive a target of 47.00. Elliott Wave analysis also suggests a decline to 47.00.
The Bank Index has broken a Head & Shoulders neckline.
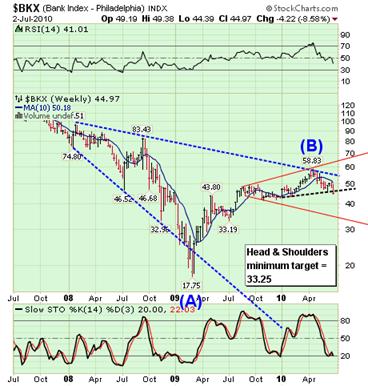 --This week, $BKX violated the neckline of a Head & Shoulders pattern at 46.04. This breach gives it a potential minimum target at 33.25, near its Orthodox Broadening Top lower red trendline. Notice how close this target is to the July 2009 low.
The move outlined above may set up yet antoher Head & Shoulders pattern with a potential target near 20.00 or below.
The Shanghai Index succumbs to bad news.
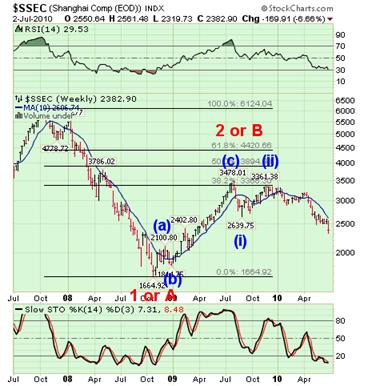 --The Shanghai Index was hit with some very bad news this week, which is the hallmark of the onset of a third wave. The base that the index appeared to be building turned quickly into a bearish flag, indicating a much lower target.
We may still regard May 17th was an ideal date for the $SSEC Seasonal cyclical low. What this does, however, is indicate a very left-translated cycle which has a long way to go before completion.
The rally in $USB met Fibonacci resistance.
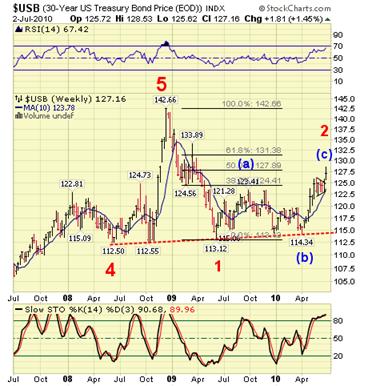 -- The triangle formation in $USB gave us fair warning that this was the final rally. I speculated last week that we might not reach the Fibonacci 50% retracement, but it was handily accomplished by July 1st, followed by a reversal.
I am now projecting a “major low” within the next two weeks. The rally has simply run out of time. It could be that $USB may challenge its trendline low at 115.00 at the next projected bottom. This kind of activity disputes the idea that the flight to safety will be to bonds from this point forward. It also suggests that we may be facing solvency, not liquidity issues, going forward.
$USD made a deeper correction and caused a pattern shift.
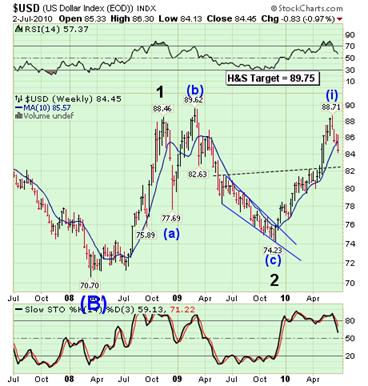 -- $USD made a deeper correction this week and has caused me to re-label its wave pattern. It may have had a near miss of its Head and Shoulders target at 89.75, which isn’t that unusual. What this week’s action does is set up a potentially larger Head and Shoulders pattern with a neckline at the 88.71 high. A look at a 5-year $USD chart shows a massive inverse H&S pattern with a potential target of 108.50. The pattern contained in this chart is only the head and right shoulder. I may illustrate it next week, as $USD approaches the new neckline.
I hope you all have a wonderful weekend!
Regards,
Tony
Traders alert: The Practical Investor is currently offering the daily Inner Circle Newsletter to new subscribers. Contact us at tpi@thepracticalinvestor.com for a free sample newsletter and subscription information.
Our Investment Advisor Registration is on the Web
We are in the process of updating our website at www.thepracticalinvestor.com to have more information on our services. Log on and click on Advisor Registration to get more details.
If you are a client or wish to become one, please make an appointment to discuss our investment strategies by calling Connie or Tony at (517) 699-1554, ext 10 or 11. Or e-mail us at tpi@thepracticalinvestor.com .
Anthony M. Cherniawski, President and CIO http://www.thepracticalinvestor.com
As a State Registered Investment Advisor, The Practical Investor (TPI) manages private client investment portfolios using a proprietary investment strategy created by Chief Investment Officer Tony Cherniawski. Throughout 2000-01, when many investors felt the pain of double digit market losses, TPI successfully navigated the choppy investment waters, creating a profit for our private investment clients. With a focus on preserving assets and capitalizing on opportunities, TPI clients benefited greatly from the TPI strategies, allowing them to stay on track with their life goals
Disclaimer: The content in this article is written for educational and informational purposes only. There is no offer or recommendation to buy or sell any security and no information contained here should be interpreted or construed as investment advice. Do you own due diligence as the information in this article is the opinion of Anthony M. Cherniawski and subject to change without notice.
Anthony M. Cherniawski Archive |
© 2005-2022 http://www.MarketOracle.co.uk - The Market Oracle is a FREE Daily Financial Markets Analysis & Forecasting online publication.