


Was S&P 1220 The Stocks Secular Bear Market Rally Top?
Stock-Markets / Stocks Bear Market Jul 04, 2010 - 06:29 PM GMTBy: Andre_Gratian

 Current Position of the Market
Very Long-term trend - Down! The very-long-term cycles are down and if they make their lows when expected, the bear market which started in October 2007 should continue until about 2014-2015.
SPX: Intermediate trend - The index made an intermediate top at 1220 and is now in a confirmed intermediate downtrend.
Analysis of the short-term trend is done on a daily basis with the help of hourly charts. It is an important adjunct to the analysis of daily and weekly charts which determines the course of longer market trends.
Daily market analysis of the short term trend is reserved for subscribers. If you would like to sign up for a FREE 4-week trial period of daily comments, please let me know at ajg@cybertrails.com .
Overview:
My expectation for the longer-term trend has been that the previous bear market bottomed in March 2009 and that we are in a new bull market that could go into 2011.
The Monthly Chart (above) provides an alternative scenario. The main difference is that the uptrend which was started in March 2009 by the SPX may not extend into 2011, but already came to an end on April 26 at 1220. This should be confirmed by the inability of the rise out of the 4-yr cycle low to exceed that level.
At this time, either scenario is possible, and the correct one will be determined by how much downward pressure is generated by the 4-yr cycle as it makes its low and how strong an uptrend comes afterward.
The weakness caused by the 2-yr cycle -- which is likely to bottom around 7/12 -- has now extended the decline which started at the end of April into one of intermediate nature. Although a good rally is expected after the cycle has made its low, it will be limited in scope by the downward pressure of the 4-year cycle which is anticipated to last into about October, although there is a possibility that the 4-year cycle will make its low earlier. The 4-yr cycle low, whenever it occurs, is not expected to challenge the March 2009 level.
Let’s now analyze the near term to determine when and at what level the current decline might come to an end.
Analysis
Chart Pattern and Momentum
I have drawn red channel lines to define the current downtrend. These may have to be modified somewhat as more data becomes available. I have marked the low of the 2-yr cycle with an ideal price projection of 996 around July 12.
SPX Weekly
The current profile of the indicators at the bottom of the chart is telling us that we are not quite ready for a reversal, but we are potentially getting close. The most interesting indicator is the lowest one. It is the MACD of the daily A/D figure, and it closely replicates the McClellan oscillator. The reason that it is so interesting is that it is remaining well above its previous low while the index is making a new low, something that you would not expect if the index was as weak as it appears to be.
The price MACD (the top oscillator) is also beginning to show potential positive divergence, and the middle oscillator is oversold. These are all signs that we are approaching a low and that the ideal price and time targets which are now just a few points and a few trading days away may turn out to be fairly accurate.
Next, is the Hourly Chart. The index and the indicators have been in uptrends for the last two days and price could briefly come out of its down-channel before the final low is made. The momentum indicators are still trending up and are not quite ready to turn down. The red channel defines either the second or the third phase of the downtrend from the 1220 top -- take your choice. It’s murky enough to make it difficult for those who want to use EW analysis.
The bottoming 17-wk cycle started this phase of the decline, but it was a dud when it came to providing a rally after it had made its low. It only managed a brief sideways crawling pattern along the lower support line of the larger corrective move before prices fell out of bed to continue their declines.
The hourly chart confirms that the daily indicators are not ready for a reversal, but that a brief extension of the decline could put them in that position.
Cycles
In spite of the fact that it took a long time to turn prices down, the 17-wk came pretty much on schedule.
The 2-year cycle is expected to make its low around 7/12, and this should be followed by a good rally. There is also a 77-wk cycle which may bottom at the same time.
The 4-year cycle has not always made a low in October. It has occasionally done so in mid-year, as it did in 2006. We will therefore have to be prepared for this contingency. Perhaps this is the reason we are getting this much weakness at the present time.
Projections:
When the SPX made its top at 1220, it created a distribution pattern on the Point & Figure chart which, when broken down into phases, gave a potential phase count to about 1000. Since there is also a Fibonacci projection of 996 which developed as the decline progressed, the two projections reinforce each other and give us a fairly probable price target in that area for the low of the 2-yr cycle and the end of the downtrend from 1131.
Breadth
In the last newsletter, I wrote: “The NYSE Summation index (courtesy of StockCharts.com) may be giving us a warning about the longer term trend. Since its August peak of last year, the index has been in a downtrend, making a series of lower lows.”
That was then! Now, the index is showing some positive divergence to the price index by making a higher low -- the same thing that you see taking place on the daily A/D indicator. The divergence is also reflected in the NYSI RSI which is remaining higher than its former low.
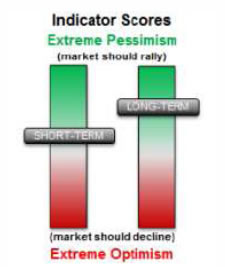
Market Leaders and Sentiment
Throughout the previous rally, the SentimenTrader (courtesy of same) remained bullish, and this bullishness is now increasing -- another sign that we are approaching a low in the downtrend.
The current readings of the NYSI and of the sentiment index belie the intensity of the weakness which is suggested by the sharp decline of the price index during this time period. This could be a hint that, after the cycle has made its low, there will be a good rally.
I have not pointed out the apparent Head & Shoulder pattern which has formed in the SPX over the past 6 months. Everyone else has, and that’s a very good reason to be suspicious of its validity. Considering the lack of weakness which is suggested by the two indicators mentioned above, I believe that the next rally will invalidate the H&S formation.
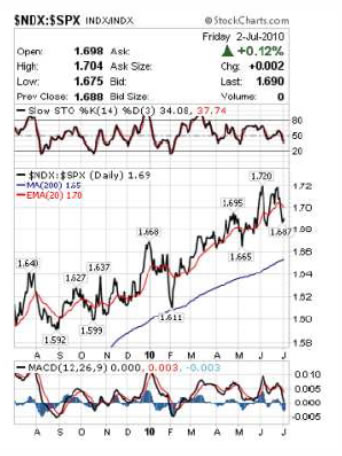
Looking at the relative strength of the NDX to the SPX, we find the same lack of confirmation of the market weakness. In a really weak market that is going to remain weak, the NDX should be relatively weaker than the SPX. Perhaps the relationship will continue to deteriorate in the future, but for now, my interpretation of this index does not suggest a weak market directly ahead. In the next rally the relationship may change.
Gold
In the last newsletter, I pointed to the negative divergence which was showing between the price of GLD and its indicators. I also mentioned that the ETF had reached its minimum Point & Figure projection of 122. This made it vulnerable to a correction, perhaps one of lengthy nature, because negative divergence also shows on the weekly chart.
Last week, GLD had a sharp drop which took it outside of its steepest channel (green). Although this could be the start of an intermediate decline, more proof is required.
There is long-term support just below 115 and the top P&F formation at the 122 level gives us a potential phase projection to 115. The count across the full span of the distribution area has a maximum target of 106. This could be the destination of the index if protracted weakness continues.
However, 122 was the minimum upside count. There is also a valid count to 127-128. For this reason, we should not take it as certainty that the index is going to go beyond 115, but we should let the market decide -- which it should do in the next couple of weeks.
We’ll re-visit GLD in the next newsletter.
Summary
There is some ambiguity about whether or not 1220 was the top of a secondary reaction in a secular bear market. This should clear up over the next few months.
The current trader-dominated market activity is creating a high level of volatility in which it is often difficult to determine the lasting strength or weakness in moves. There are several indicators which suggest that the prevailing downtrend may not be accurately reflecting the degree of weakness that it suggests. This may mean that the next uptrend could be quite a bit stronger than most expect.
If precision in market timing is something which is important to you, you should consider a trial subscription to my service. It is free, and you will have four weeks to evaluate the claims made by the following subscribers:
Thanks for all your help. You have done a superb job in what is obviously a difficult market to gauge. J.D.
Unbelievable call. U nailed it, and never backed off. C.S.
I hope you can teach me about the market and the cycles. I want to be like you and be the best at it. F.J.
But don't take their word for it! Find out for yourself with a FREE 4-week trial. Send an email to ajg@cybertrails.com .
By Andre Gratian
MarketTurningPoints.com
A market advisory service should be evaluated on the basis of its forecasting accuracy and cost. At $25.00 per month, this service is probably the best all-around value. Two areas of analysis that are unmatched anywhere else -- cycles (from 2.5-wk to 18-years and longer) and accurate, coordinated Point & Figure and Fibonacci projections -- are combined with other methodologies to bring you weekly reports and frequent daily updates.
“By the Law of Periodical Repetition, everything which has happened once must happen again, and again, and again -- and not capriciously, but at regular periods, and each thing in its own period, not another’s, and each obeying its own law … The same Nature which delights in periodical repetition in the sky is the Nature which orders the affairs of the earth. Let us not underrate the value of that hint.” -- Mark Twain
You may also want to visit the Market Turning Points website to familiarize yourself with my philosophy and strategy.www.marketurningpoints.com
Disclaimer - The above comments about the financial markets are based purely on what I consider to be sound technical analysis principles uncompromised by fundamental considerations. They represent my own opinion and are not meant to be construed as trading or investment advice, but are offered as an analytical point of view which might be of interest to those who follow stock market cycles and technical analysis.
Andre Gratian Archive |
© 2005-2022 http://www.MarketOracle.co.uk - The Market Oracle is a FREE Daily Financial Markets Analysis & Forecasting online publication.