


U.S. Stocks Death Cross, Heading Down, Deeper and Down
Stock-Markets / Stocks Bear Market Jul 06, 2010 - 03:15 AM GMTBy: Bob_Kirtley

 After an impressive rally of over 80% from the lows made in March 2009, the US stock market looks ripe for another plunge south. This rally was never sustainable, rather than being built on solid fundamentals and a genuine economic and business recovery, it was merely the result of multi-billion dollar bailouts, near zero interest rates and the feeling that no matter how bad things get, the government will save the day and stop any Armageddon scenario.
Although this may be true, the government may indeed be able to prevent the apoplectic scenarios many feared would eventuate during the financial crisis, this does not mean that the governments and central banks of the world can conjure strong, consistent, sustainable growth in the global economy, nor a permanent bull market in stocks. Sure pumping trillions into the system and slashing rates to zero is bound to have some effect and give markets a boost, but what now? The markets have had a shot of adrenaline, but it now appears there isn't much else to get excited about from a bullish perspective.
In fact it is those who are short the market that should be getting excited, especially when one examines the technical position of the S&P and Dow at present.
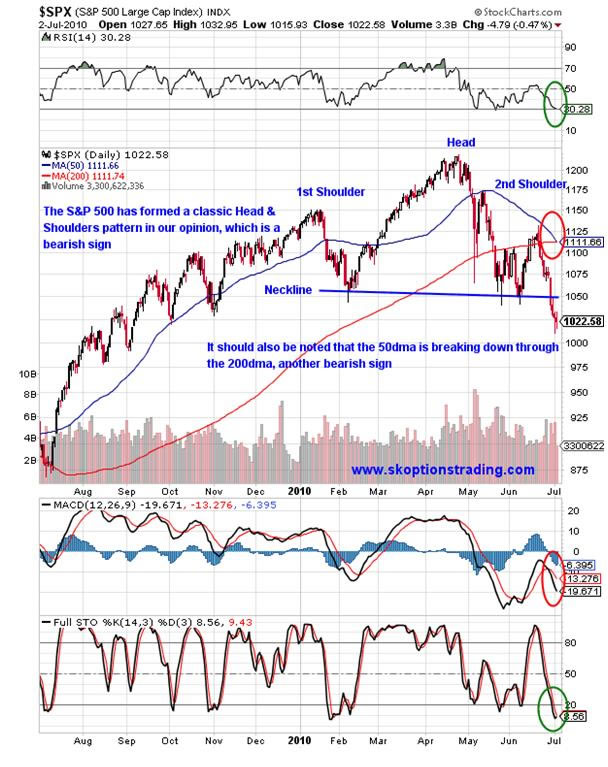
As the chart above shows, there is a clear head and shoulders pattern on the S&P 500. This is a bearish formation and often considered one of the most reliable trend reversal patterns, so in this case the pattern suggests the trend is changing from up to down. The key points of the head and two shoulders are marked on the chart, but attention must also be paid to the neckline. This acts as a support level until broken, when it then becomes a resistance level. Also a neckline with a negative gradient, as is the case above, can be considered a more bearish formation than one with a flat or positively sloping neckline. The fact that the neckline is broken was the last confirmation we needed to become bearish on the S&P 500 and equivalent stock indices.
Looking to a shorter time frame, the green circles highlight the semi-bullish technical signals; the RSI is at 30.28 which is nearly in the oversold zone and the Full STO which is oversold and may give a bullish crossover. There is always conflict between technical signals, however the skill to executing a successful trade is in the trader's ability to weigh up the different indicators and come to a conclusion on the direction of the market.
Another technical factor that contributed to our conclusion that US markets are heading lower is the "Death Cross" and appears to have just occurred, or is in the process of happening. This is when the 50 day moving average comes down and breaks down through the 200 day moving average and it is a bearish signal. We do not have to look far to find a case where the Death Cross worked out exactly how it was theoretical meant to.
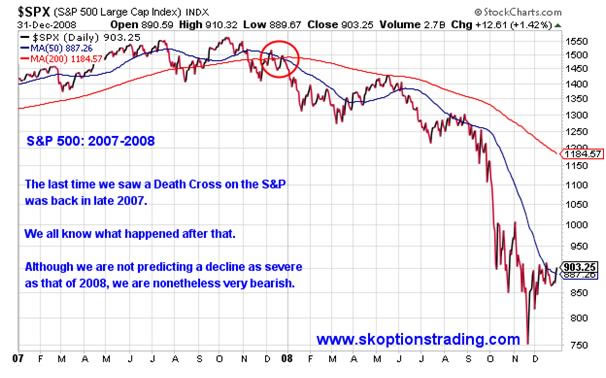
Although we do not foresee a decline as rapid nor as severe as that in the chart above, we do see a decline worth trading, so we are currently short on the S&P 500, and we will continue to build our short position on any mini rallies in the market.
Our premium options trading service OptionTrader, is currently averaging a return of over 40% per trade, in less than 40 days per trade. The service only costs $99, so one trade of $1000 at the average return of 40% bags a $400 profit, paying for your subscription more than four times over!
We aim to optimize our returns using options to limit our risk and maximise our returns, and anticipate great returns from this upcoming decline in the US stock market. Get on board now by visiting our website www.skoptionstrading.com for more information and to sign up now!
Have a good one.
By Sam Kirtley
Recently our premium options trading service OPTIONTRADER has been putting in a great performance, the last 16 trades with an average gain of 42.73% per trade, in an average of just under 38 days per trade. Click here to sign up or find out more.
Silver-prices.net have been rather fortunate to close both the $15.00 and the$16.00 options trade on Silver Wheaton Corporation, with both returning a little over 100% profit.
To stay updated on our market commentary, which gold stocks we are buying and why, please subscribe to The Gold Prices Newsletter, completely FREE of charge. Simply click here and enter your email address. (Winners of the GoldDrivers Stock Picking Competition 2007)
DISCLAIMER : Gold Prices makes no guarantee or warranty on the accuracy or completeness of the data provided on this site. Nothing contained herein is intended or shall be deemed to be investment advice, implied or otherwise. This website represents our views and nothing more than that. Always consult your registered advisor to assist you with your investments. We accept no liability for any loss arising from the use of the data contained on this website. We may or may not hold a position in these securities at any given time and reserve the right to buy and sell as we think fit.
Bob Kirtley Archive |
© 2005-2022 http://www.MarketOracle.co.uk - The Market Oracle is a FREE Daily Financial Markets Analysis & Forecasting online publication.