


Gold and Silver Good and Bad News
Commodities / Gold and Silver 2010 Jul 08, 2010 - 01:49 AM GMTBy: Peter_Degraaf

 “The future ain’t what it used to be”. …..Yogi Berra
Judging by several E-mails I’ve received from anxious readers of my articles during the past few days, some of you are wondering if you should have ‘sold in May and gone away.’
Let’s look at a chart from last year and see if that strategy would have worked in 2009.
(Charts in this report are courtesy Stockcharts.com unless indicated).
Here is the daily bar chart for gold from last year. Selling in May (green rectangle) and going away would not have been a good idea in 2009. The good news is that the best buying opportunities for buying gold and silver usually come in May – June – July.
“There can be no other criterion, no other standard than gold.
Yes, gold which never changes, which can be turned into ingots
bars, coins, which has no nationality and which is eternally and
universally accepted as the unalterable fiduciary value par excellence”
…..Charles Degaulle.
What if 2009 was an exception? Might ‘selling in May and going away’ have worked in some other year?
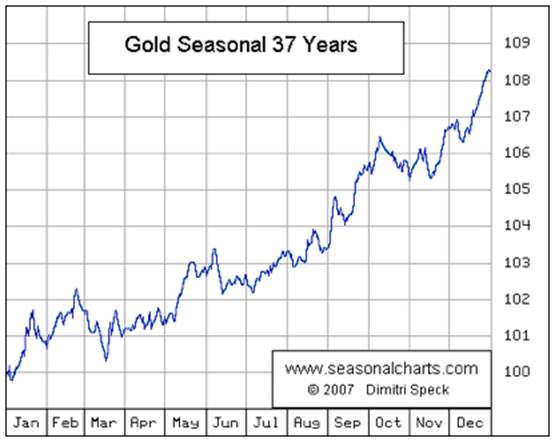
This chart is courtesy Dimitri Speck at Seasonalcharts.com. He last updated this chart in 2007, but it covers gold data from 1971 to 2007. Here we see that almost every year the months of May – June – July offer some great buying opportunities. Good News!
Featured next is the weekly gold chart. The blue arrows point to bottoms in the 7 – 8 week gold cycle. My subscribers and I watch this cycle continually in order to buy as close to the cycle bottom as possible and then take some profits near the top of the cycle. The cycle can bottom a week early or put in a bottom up to two weeks late. We are presently in week # 7 in the cycle and there is a good possibility that the low point reached on Tuesday July 6th and early Wednesday July 7th will turn out to be the bottom in this latest cycle right on schedule during week #7. In the event that these lows hold and we see gold and silver rising from here, then the next cycle advance will be underway. All we need now is confirmation that the cycle bottom is in place. That will come as the gold price rises and supporting indicators begin to provide confirmation. Cycle bottoms are Good News.
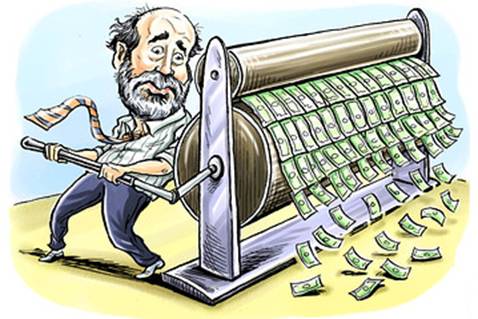
This drawing by Chad Crowe, courtesy Goldstocksdaily.com shows Mr. Bernanke is getting ready to make good on his promise to drop money from helicopters.
This counterfeiting activity is bad news for people on fixed incomes, but good news for people who buy physical gold and silver to protect themselves from Mr. Bernanke and his Keynesian friends.
In the history of civilization, there is not one country that escaped the destruction of its fiat currency, once monetary inflation became part of the process …..Not one!
This chart courtesy Bloomberg and Erste Group Research shows the depreciation of seven currencies measured against the price of gold. ‘A trend in motion remains in motion until it is stopped.’ Until these currencies cease to be surreptitiously destroyed via monetary inflation, this downtrend (uptrend for gold), will continue. This is bad news for people who have bank accounts and good news for people who buy gold and silver, regardless of what month it happens to be. As Marc Faber likes to say: “The important thing is that you’re buying ounces.”
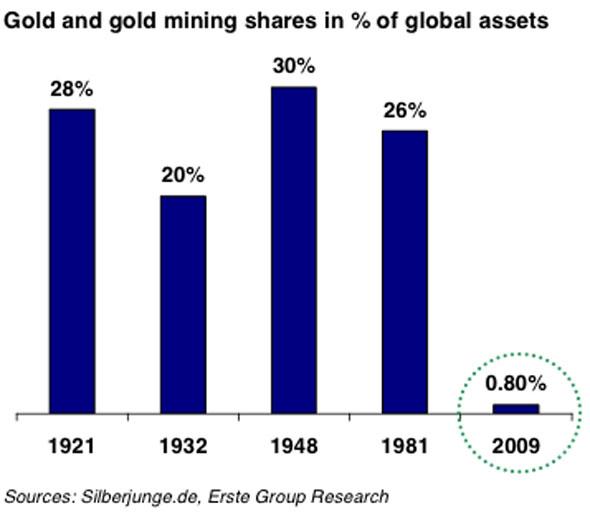
This chart courtesy Businessinsider.com and Erste Group Research shows the percentage that gold and gold shares take up within the total global assets at the moment, compared to four different eras.
The assumption is that some of these ‘other assets’ (99% in 2009) will be transferred into gold assets. A rise from 0.8% to 20% of the total is a minimum to be expected, as this will bring the percentage up to the 1932 equivelant. This should convince the reader that the current gold bull market is still in its infancy and that is good news!
Capitalism is the financial system that puts capital to work. The true definition of a capitalist is someone whose capital is working for him or her.
This chart courtesy Wirtschaftswoche, Bloomberg, Wikipedia and Erste Group Research shows in chart form the remarkable trend reversal from gold sales to gold purchases in 2009, on the part of the Central Banks of the world. This is bad news for the gold bears (including the bullion banks that hold massive short positions), but good news for people who buy and hold physical gold (as opposed to ‘paper gold’ which is after all just a promise).
It is in the interest of central banks along with the bullion banks that are co-operating, to keep the price of gold as low as possible, to hide the effects of monetary inflation from the public.
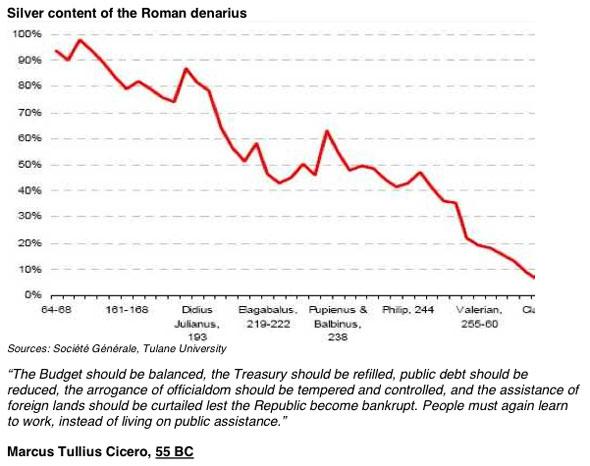
This chart, courtesy Businessinsider.com shows us that monetary inflation (watering down of currency values), is nothing new. The silver content reduction from nearly 100% down to 8%, was done gradually over a period of hundreds of years. A lot of people never noticed the trend! “It’s déjà vu all over again.” …Yogi Berra.
This trend is bad news for people on fixed incomes and those holding fixed rate investments. It is good news for people who own pure gold and pure silver.
“A black market is a free market operating against the wishes of the state.” - ….Harry Browne.
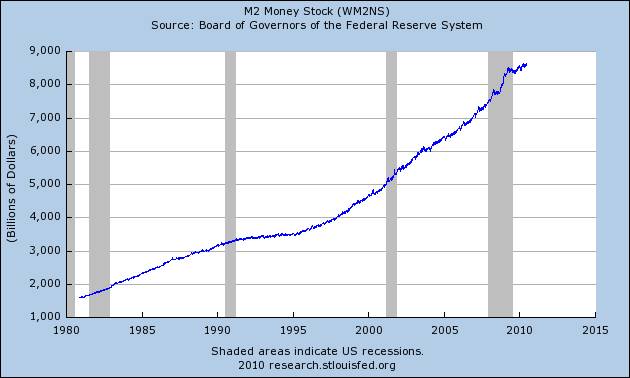
This chart courtesy Federal Reserve Bank of St. Louis, muzzles the members of the deflation crowd who say there is no monetary inflation. ‘Liars can figure, but figures don’t lie’ (to paraphrase an old saying), and this chart is quite convincing.
“Nations are not ruined by one act of violence, but gradually and in an almost imperceptible manner, by the depreciation of their circulating currency, through excessive quantity. …..Nicolaus Copernicus (Uttered in 1525).
Featured is the daily silver chart. Price is carving out a bullish inverted ‘head and shoulders pattern. A breakout at the blue arrow sets up a target at 30.00
The green arrow points to the positive alignment between the 50DMA and 200DMA while both are rising. That is good news!
Gold's huge drop on Thursday July 1st is not the beginning of a new major leg down for the yellow metal. That at least is the conclusion reached by a contrarian analysis of gold market sentiment. There does not currently exist the kind of stubborn optimism among gold timers that is the hallmark of major market tops...The bottom line? The sentiment winds will be blowing strongly in the gold market's sails in coming sessions”
……….Mark Hulbert
(And that is good news for those who own gold and silver).
Happy trading!
By Peter Degraaf
Peter Degraaf is an on-line stock trader with over 50 years of investing experience. He issues a weekend report on the markets for his many subscribers. For a sample issue send him an E-mail at itiswell@cogeco.net , or visit his website at www.pdegraaf.com where you will find many long-term charts, as well as an interesting collection of Worthwhile Quotes that make for fascinating reading.
© 2010 Copyright Peter Degraaf - All Rights Reserved
DISCLAIMER: Please do your own due diligence. I am NOT responsible for your trading decisions.
Peter Degraaf Archive |
© 2005-2022 http://www.MarketOracle.co.uk - The Market Oracle is a FREE Daily Financial Markets Analysis & Forecasting online publication.