Latest ECRI Economic Leading Indicator Confirms Bearish Stock Outlook!
Stock-Markets / Stocks Bear Market Jul 14, 2010 - 07:51 AM GMTBy: Claus_Vogt
 In last week’s Money and Markets column, I recommended getting out of the stock market. This was based on my cyclical model having turned bearish. Plus there was a clear breakout of the S&P 500 and many other global indexes from their well-formed, topping formations.
On the same day my column came out, stock markets around the world started a nice rally … and in just three days the S&P 500 was up nearly 5 percent!
Of special interest is the fact that the index is back above the lower boundary of its topping formation. Therefore, I think it deserves a second look to see whether this rally is important enough to declare my sell signal a failure.
First of all, I only use technical analysis as an auxiliary function. It helps me fine tune my trading decisions based predominantly on my cyclical model. This model is composed of many single indicators, which I group into four broad categories:
- Fundamental valuation Monetary or liquidity conditions Sentiment indicators
- Leading economic indicators
 |
| The most recent WLI reading further confirmed a bear market in the making. |
As I discussed last week all of the categories are clearly negative. And taken together they strongly argue that a severe bear market is in the offing.
Then last Friday …
My Cyclical Model Got Even More Bearish!
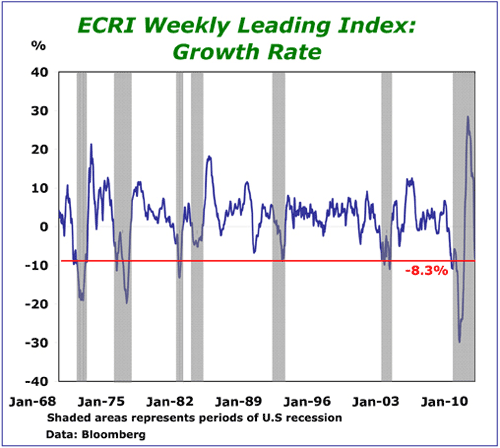
On July 9, the Economic Cycle Research Institute (ECRI) published its weekly leading index (WLI). And it fell for the fifth week in a row.
- On June 4, it crossed the zero line with a reading of minus 3.6 percent,
- On June 11 — minus 5.6 percent,
- On June 18 — minus 6.8 percent,
- On June 25 — minus 7.6 percent,
- And for the week ending July 2 — minus 8.3 percent!
If you take a look at the chart below, you’ll see the important historical relationship between the WLI and past recessions. This clearly shows why the latest WLI reading, as well as the persistency of the decline, support my argument of a double-dip recession hitting the U.S.

And that’s not all …
As was the case in 2007, signs of a weakening economy are not just coming from the U.S., but from all around the world, too!
Leading economic indicators like the Purchasing Managers Index (PMI) are down in most major economies including Japan, the UK, France, China, Taiwan, and India.
Even Germany’s PMI is stagnating! This is in spite of the euro’s remarkable decline, which acts like a huge stimulus to Germany’s economic growth engine — its export sector.
Yet …
The Technical Situation Came Back from the Brink!
Let’s now have a look at the technical picture of the stock market …
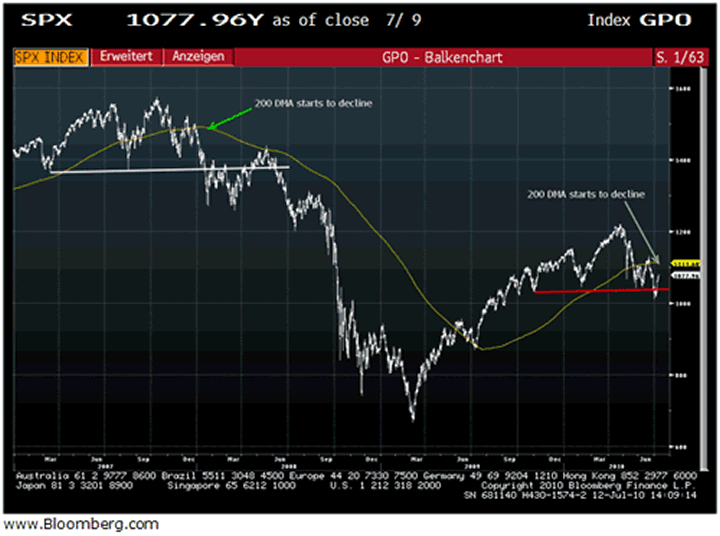
The chart below shows the S&P 500 since 2007. I’ve drawn the lower boundary, or neck line, of the 2007/2008 topping formation and the current one.
S&P 500, 2007-2010

As you can see, in 2007 the lower boundary of the topping formation was not as clearly defined as in 2010. But even back then, prices broke below the neckline and managed to climb back above it later.
Chart analysis is not a science, but an art. And technical signals usually aren’t as clear cut as they may seem in hindsight. So the current example of a seemingly false breakout followed by a return back above the neckline isn’t strange at all.
Much more important is the fact that investors who sold out of the market in January 2008 on the first break of the neckline may have looked a bit foolish by mid-May. But for the rest of the year they definitely looked like geniuses.
The current pattern of 2010 still looks very much like a topping formation. Even the 200-day moving average has started to decline — as it did in January 2008. This pattern may take a few more weeks to develop. And we may even see a decent summer rally in the coming weeks. But I wouldn’t bet on it.
With my cyclical model unequivocally bearish and the high risk of a recession, the prudent thing to do is to be out of the stock market. I believe the risks are much too high here to hang on hope for a positive surprise.
Best wishes,
Claus
This investment news is brought to you by Money and Markets. Money and Markets is a free daily investment newsletter from Martin D. Weiss and Weiss Research analysts offering the latest investing news and financial insights for the stock market, including tips and advice on investing in gold, energy and oil. Dr. Weiss is a leader in the fields of investing, interest rates, financial safety and economic forecasting. To view archives or subscribe, visit http://www.moneyandmarkets.com.
© 2005-2022 http://www.MarketOracle.co.uk - The Market Oracle is a FREE Daily Financial Markets Analysis & Forecasting online publication.


