Fed Policy on Asset Price Bubbles Inflation and Burst
Interest-Rates / Liquidity Bubble Sep 13, 2007 - 04:17 PM GMTBy: Paul_L_Kasriel
Is Mishkin Mishuga* about Asymmetric Monetary Policy Responses?
In his treatise delivered at the Fed's recent Jackson Hole retreat ( Housing and the Monetary Transmission Mechanism ), Fed Governor Mishkin hues to the Greenspan party line of an asymmetric monetary policy response to asset-price bubbles. That is, monetary policy should not be used to prevent asset-price bubbles, but rather should be used to mitigate the effects on real economic performance from the bursting of the price bubbles.
To wit, Mishkin states: "The lesson that should be drawn from Japan's experience is that the task for a central bank confronting a bubble is not to stop it but rather to respond quickly after it has burst. As long as the monetary authorities watch carefully for harmful effects stemming from the bursting bubble and respond to them in a timely fashion, then the harmful effects can probably be kept to a manageable level."
This asymmetric policy prescription is a recipe for serial asset-price bubbles. The implications of this policy are that the upside gains are unlimited for the risk taker, but the downside losses are limited. Why? Because when the Fed cuts the federal funds rate to rescue the economy from the ravages of the burst asset-price bubble, the Fed also limits the losses to the risk takers who were riding the asset prices up. You don't even have to be as smart as Pavlov's dog to figure out this "heads, I win; tails I don't lose much" game.
Why doesn't the Fed want to act to prevent asset-price bubbles?
Because it claims that it is not perceptive enough to identify these bubbles in their formation. Given the Fed's dismal forecasting record of cyclical economic turning points, I take it at its word.
Is there some alternative approach to the monetary policy operating procedures that would reduce the likelihood of the formation of asset-price bubbles without necessitating the Fed's a priori identification of bubbles?
Yes. Moreover, the approach I am about to suggest also would prevent rapid cumulative increases in the prices of goods and services, now commonly referred to as inflation. And my alternative approach would not prevent declines in the prices of goods and services that would occur "in nature" as a result of advances in productivity and technology.
What is this alternative Fed operating procedure?
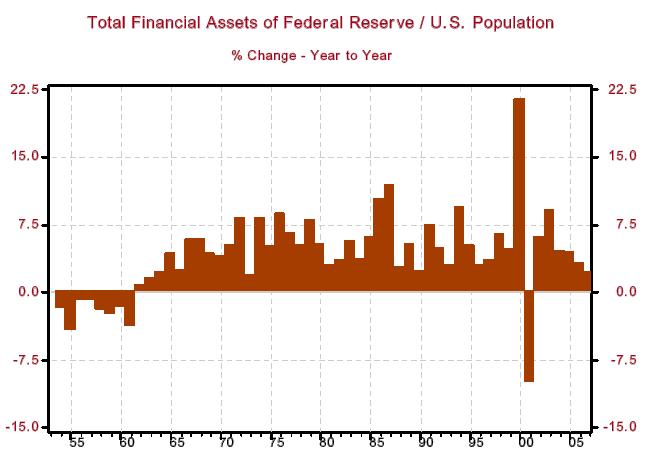
Have the Fed increase the amount of credit it creates at the rate of growth of the U.S. population. That is, keep the per capita dollar amount value of the Fed's balance sheet constant. Chart 1 shows the actual per capita growth in the Fed's balance sheet. From 1953 through 1960, the per capita change in the Fed's balance sheet was negative. With one exception, 2000, the per capita change in the Fed's balance sheet has been positive. From 1953 through 2006, the median annual percent change in the per capita value of the Fed's balance sheet has been 4.5%.
Chart 1

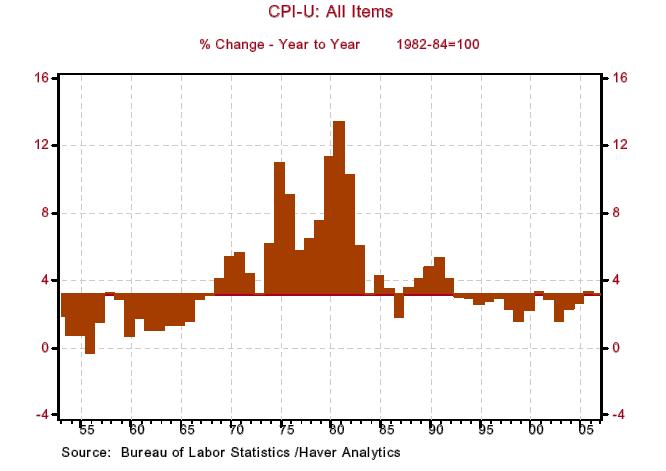
Now let's look at behavior of CPI during this period. Chart 2 shows that there have been two time spans in which the annual change in the CPI has persistently been near or below its median percent change of 3.1% in 1953 to 2006 period. Those two periods were from 1953 through 1967 and from 1992 through 2004. I would argue that the first period of below-median CPI increases was due to the contraction in the per capita value of the Fed's balance sheet from 1953 through 1960. The second period of below-median CPI increases was due to a constellation of factors - declining inflation expectations because of the Volcker-era Fed policy, post-cold-war decline in U.S. defense spending, increased productivity resulting from the implementation of technologies developed in previous years, a rightward shift in the global supply curve for goods and services emanating from China, India and central Europe, and a stagnant Japanese economy.
Chart 2

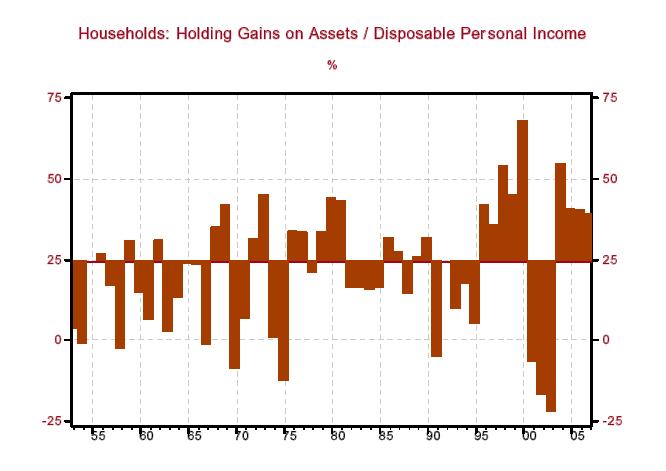
Now let's look at the behavior of asset-price increases. To measure this, I have used the holding gains on household assets - tangible and financial - as a percent of disposable personal income. The median percentage of this in the 1953 to 2006 period was 24.5%. From 1953 through 1966, asset price increases were generally near or below the median. This coincides with a period of relatively mild increases in the CPI. Again, the period from 1953 through 1960 was characterized by a persistent contraction in the per capita value of the Fed's balance sheet.
Outliers of asset-price increases occurred from 1995 through 1999 (NASDAQ bubble) and 2003 through 2006 (housing bubble). The outlier periods of asset-price increases occurred when CPI increases were relatively mild but there was growth in the per capita value of the Fed's balance sheet. If the Fed is increasing the value of its balance sheet relative to population growth in a period of "naturally-induced" mild increases in the prices of goods and services, that Fed-created credit is likely to be used to inflate asset prices.
Chart 3

So, a good way for the Fed to prevent asset-price bubbles is to limit the amount of credit it creates. By following a rule of increasing the value of its balance sheet at a rate no faster than that of population growth, the Fed would be able to keep the prices of goods and services from rising rapidly and , without having to identify an asset-price bubble a priori , could also prevent the formation of asset-price bubbles. Of course, adopting the gold standard would be superior to my suggestion. But as low as the probabilities are for the Fed to adopt my prescription, the probabilities are even lower that the Fed would opt to go back on the gold standard.
* Mishuga is Yiddish for loco.
*Paul Kasriel is the recipient of the 2006 Lawrence R. Klein Award for Blue Chip Forecasting Accuracy
By Paul L. Kasriel
The Northern Trust Company
Economic Research Department - Daily Global Commentary
Copyright © 2007 Paul Kasriel
Paul joined the economic research unit of The Northern Trust Company in 1986 as Vice President and Economist, being named Senior Vice President and Director of Economic Research in 2000. His economic and interest rate forecasts are used both internally and by clients. The accuracy of the Economic Research Department's forecasts has consistently been highly-ranked in the Blue Chip survey of about 50 forecasters over the years. To that point, Paul received the prestigious 2006 Lawrence R. Klein Award for having the most accurate economic forecast among the Blue Chip survey participants for the years 2002 through 2005.
The opinions expressed herein are those of the author and do not necessarily represent the views of The Northern Trust Company. The Northern Trust Company does not warrant the accuracy or completeness of information contained herein, such information is subject to change and is not intended to influence your investment decisions.
Paul L. Kasriel Archive |
© 2005-2022 http://www.MarketOracle.co.uk - The Market Oracle is a FREE Daily Financial Markets Analysis & Forecasting online publication.


