Gold GLD ETF Eyeing 200-Day Moving Average
Commodities / Gold and Silver 2010 Jul 28, 2010 - 03:42 PM GMTBy: Mike_Paulenoff
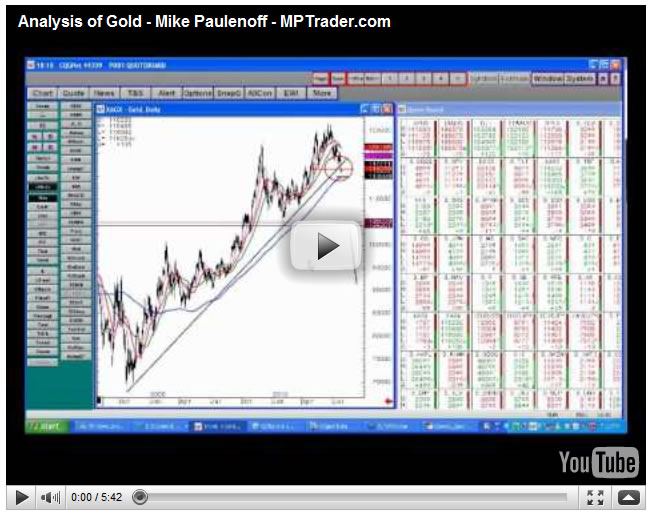
 In our Webinar last night, we discussed gold and the SPDR Gold Shares (NYSE: GLD), which has been a liquidating market. The GLD closed at 113.50 off a low of 113.21, and the 200-day moving average is 112.06.
The relative strength indicator points straight down, which leads me to believe the GLD will test the average, and I want to stay in for that test to see if it gets some sort of reversal from there. If it doesn't and can't seem to rally off the average, then I will stand aside and let it go down another $5 and see what it looks like down at 104-105, the next area for it to hold logically and where I'd be looking to get long again.
If it breaks the prior low from February at 102.28, then I think we're looking at 93, or $930 an ounce.
Sign up for a free 15-day trial to Mike's ETF & Stock Trading Diary today.
By Mike Paulenoff
Mike Paulenoff is author of MPTrader.com (www.mptrader.com), a real-time diary of his technical analysis and trading alerts on ETFs covering metals, energy, equity indices, currencies, Treasuries, and specific industries and international regions.
© 2002-2010 MPTrader.com, an AdviceTrade publication. All rights reserved. Any publication, distribution, retransmission or reproduction of information or data contained on this Web site without written consent from MPTrader is prohibited. See our disclaimer.
Mike Paulenoff Archive |
© 2005-2022 http://www.MarketOracle.co.uk - The Market Oracle is a FREE Daily Financial Markets Analysis & Forecasting online publication.


