ISM Manufacturing Report Points Slowing U.S. Economy
Economics / US Economy Aug 02, 2010 - 05:48 PM GMTBy: Paul_L_Kasriel
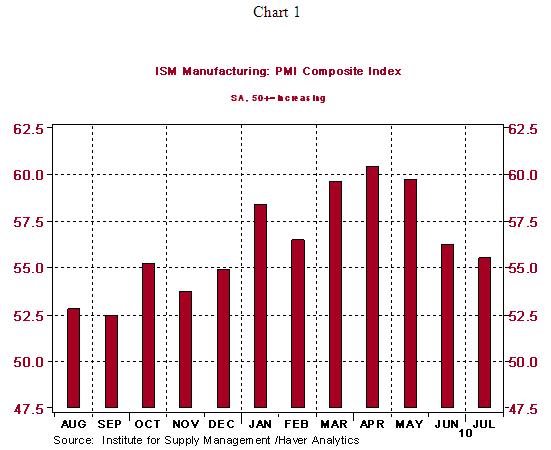
 The July ISM manufacturing composite index slipped 0.7 points to a level of 55.5. This marks the third consecutive decline in this index (see Chart 1). Although the supplier deliveries and employment indexes increased marginally (by 1.0 and 0.8 points, respectively), the July composite index would have declined by significantly more if it had not been for the 4.4 point increase in the inventories index.
In contrast, the July production index slipped by 4.4 points to a level of 57.0 - the third consecutive decline in this index and the lowest reading of the level since September 2009. The near-term outlook for production is getting even darker inasmuch as the new orders index dropped 5.0 points in July after a 7.2 point decline in June. At 53.5, the level of the new orders index is the lowest since June 2009, the month in which we believe the recession ended. Back orders also are declining.
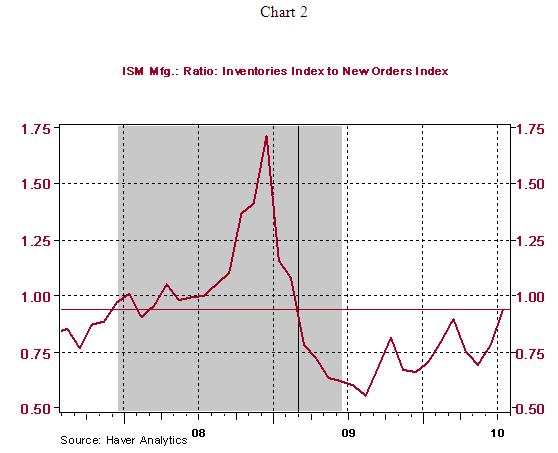
The combination of a decline in new orders and a rise in inventories has negative implications for near-term production. With demand slowing and inventories building, there will be cut backs in new ordering all along the manufacturing production chain. Chart 2 shows that the ratio of the inventories index to the new orders index reached its highest level in July since February 2009.
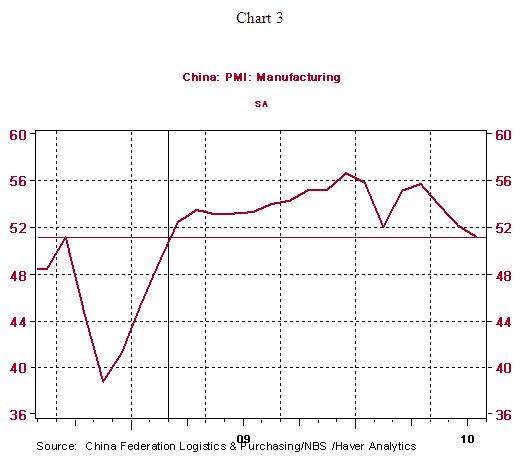
The 4.0 point decline in the July new import order index probably most likely resulted, in part, from the undesired build up of inventories. Why order more when you have more than enough on hand to meet the weaker current demand? And from what country do we do a lot of importing? China, of course. The rise in undesired inventories in the U.S. appears to be having a knock-on effect with regard to Chinese manufacturing. The Chinese composite purchasing managers' index fell for the third consecutive month in July to a level of 51.2 - the lowest reading since February 2009 (see Chart 3).
Private Construction Activity Ended the Second Quarter on a Sour Note
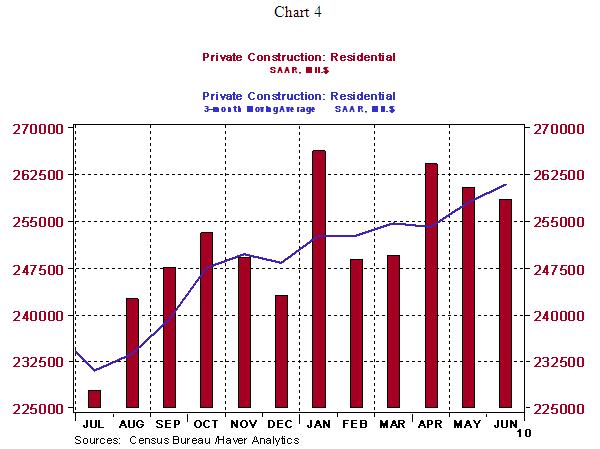
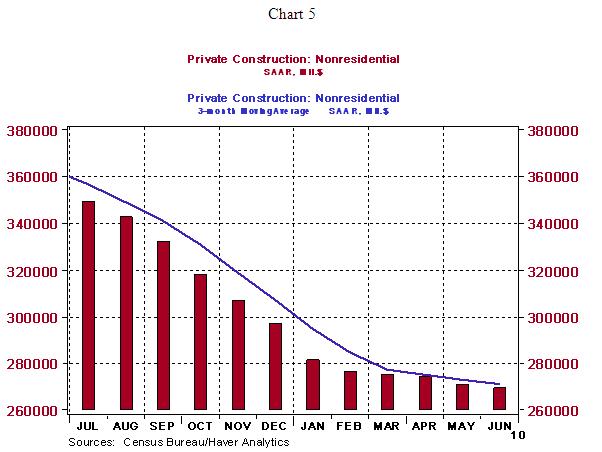
Although total construction spending was reported to have increased by 0.1% in June, this modest increase occurred in the context of a May decline that was revised sharply lower - minus 1.0% vs. a first-reported minus 0.2%. Private construction spending in June declined by 0.6% in total, with private residential construction spending falling 0.8% and private nonresidential construction spending falling 0.5%. Total government construction spending increased by 1.5%, with state & local spending rising 1.1% or by $3.1 billion saar and federal spending rising 4.6% or by $1.4 billion saar. By far the largest increase in state & local government spending was related to power projects (an increase of $2.3 billion.
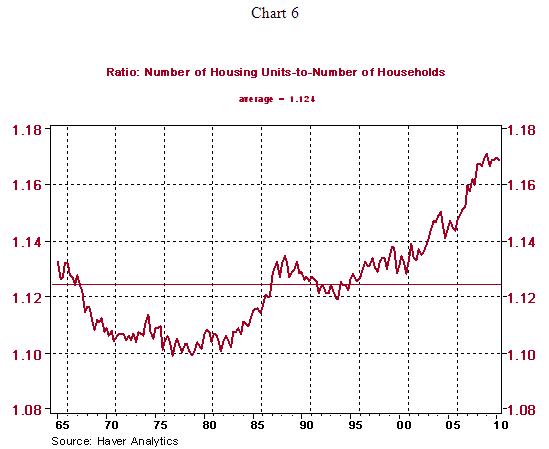
Arithmetically speaking, third-quarter private construction spending starts with the wind in its face. This is because the June levels of both private residential and private nonresidential construction spending were below the second-quarter average (see Charts 4 and 5). This means that the pace of private spending has to pick up just to get the third-quarter average level back to the second-quarter average level. With the home-purchase tax credit having expired, which chummed home sales in the second quarter, and with a still large excess supply of housing units relative to households (see Chart 6), a significant increase in private residential construction in the near term is unlikely.
Bernanke Speaks --No Clue
The Fed chairman, speaking to the Southern Legislative Conference of the Council of State Governments, gave us no clue as to contemplated changes in near-term monetary policy. We did not expect any clues this soon after his semi-annual report to Congress on monetary policy and this soon before the next scheduled FOMC meeting on August 10.
To condense Bernanke's views on the near-term economic outlook with my personal editorializing in italics, the aggregate demand will continue to grow as businesses keep buying software and equipment even with low rates of capacity utilization and slowing demand for their products and services, household spending will pick up even though no one will lend to them or hire them and exports will continue to grow even as the pace of economic activity in developing economies slows. But state & local government spending will be a drag for as far as the eye can see.
The opinions expressed herein are those of the author and do not necessarily represent the views of The Northern Trust Company. The Northern Trust Company does not warrant the accuracy or completeness of information contained herein, such information is subject to change and is not intended to influence your investment decisions.
by Paul Kasriel
Paul Kasriel is the recipient of the 2006 Lawrence R. Klein Award for Blue Chip Forecasting Accuracy
by Paul Kasriel
The Northern Trust Company
Economic Research Department - Daily Global Commentary
Copyright © 2010 Paul Kasriel
Paul joined the economic research unit of The Northern Trust Company in 1986 as Vice President and Economist, being named Senior Vice President and Director of Economic Research in 2000. His economic and interest rate forecasts are used both internally and by clients. The accuracy of the Economic Research Department's forecasts has consistently been highly-ranked in the Blue Chip survey of about 50 forecasters over the years. To that point, Paul received the prestigious 2006 Lawrence R. Klein Award for having the most accurate economic forecast among the Blue Chip survey participants for the years 2002 through 2005.
The opinions expressed herein are those of the author and do not necessarily represent the views of The Northern Trust Company. The Northern Trust Company does not warrant the accuracy or completeness of information contained herein, such information is subject to change and is not intended to influence your investment decisions.
Paul L. Kasriel Archive |
© 2005-2022 http://www.MarketOracle.co.uk - The Market Oracle is a FREE Daily Financial Markets Analysis & Forecasting online publication.


