Bernanke and US Interest Rates - Between A Rock And A Hard Place
Interest-Rates / US Interest Rates Sep 17, 2007 - 11:48 AM GMTBy: Captain_Hook

 Bernanke is an academic, and he acts like one, relying on the safety of flawed models all too often. And all too often, it could be argued this is keeping him behind the curve in terms of official measures, looking at backward indicators in setting future policy. Greenspan on the other hand operated more like he came from the school of hard knocks (like a streetwise gangster), where some (neocon types) would argued he had a real feel for what need be done, and was customarily ahead of the curve in official policy measures, or backroom deals for that matter, whatever would get the job done.
Of course another way of looking at Greenspan's style is he was an insecure little egomaniac who would pander the mob far too easily. In turn then, and in consideration of all the water that flowed beneath the bridge during his tenure, the maestro made it almost impossible for the next guy to succeed in his job because of his own success, not only in using up resources (increasingly aggressive money supply growth thresholds), but also in terms of making comparisons to the new guy impossible unless he were equally crazy.
Enter Ben Bernanke, who could be saying to himself now, ‘I must have been crazy to take this job because I will come out of this looking like a fool no matter how good a job I do'. And you know what, if that's what he saying to himself now, he's right. There's no way he will come out of this situation looking good in my opinion, because the party is over. And I think he is in fact attempting to do a ‘good job' in the sense he knows this, and opposite to the Helicopter Ben label hung on him while he was busy being an academic, is not only attempting to shake this stigma, but also trying to get people understanding just how serious the problems are American's face. So, we go from monetary policy being handled by a secretive and opaque sociopath who still loves (even though he's supposedly retired) to subject the public to grandstanding, to a family man who is becoming increasingly humbled by the reality of his job the more time he spends in the position.
Between a rock and a hard place – how does such a catchphrase fit into this picture then? In a nutshell, and in relation to the above, this is where Bernanke's Fed currently resides, stuck between a rock, which is the monetary discipline a rising gold price demands, and a hard place, which is deflation. You see Bernanke cannot make the true level of monetary inflation known because if this were to become a realization by the market, gold would go up and he would be forced to either pull back on the throttle or watch increasing numbers attempt to raise prices, killing the credit cycle for sure. Of course on the other side of the equation that's exactly what the problem is, the consumer is up to his eyeballs in debt, getting older, and beginning to realize maybe he doesn't need all the toys considering it's putting in his grave prematurely. So, increasingly these two worlds appear destined to collide, one suggestive we should look forward to some degree of accelerating hyperinflation first, with the other pointing out the fact we've already been there and done that, and now we fall down go boom in deflationary collapse a la Japan circa 1990. The belief here is once the real estate bubble is popped – it's all over.
Naturally then, the mob is demanding rate relief. As alluded to above however, they've already had it. First via carry trade, where unregulated hedge funds got paid not only on unbelievably leveraged investment schemes with a zero cost of capital, but in currency gains as increasing numbers continued to jump on the bandwagon until recently. And second, through the housing related ATM machine the lax lending standards the ‘credit crunch' is predicated on provided to ‘Joe Public'. So, as mentioned in previous discussions on the subject, and although I cannot offer any cumulative totals or percentages of what all the combined monetary largesse was with the various schemes added together (the M's did not capture aggregate / hidden inflation totals correctly), it's my belief the world has already enjoyed a mild hyperinflation of sorts already then. What's more, I also think it's reflected in the gold price, but that because of various methodologies employed by a price managing establishment, gains were no where near what they should have considering the oceans of fiat currency brought into creation these past years through various means.
But now it appears both the mechanisms and benefits associated with these practices are gone, with officials now having to give away money in preventing implosion. That's right, both the Bush Bail Out and a Befuddled Bernanke are not good signs pressure in the global economy's pipe will be maintained under current management. As evidence concern exists here, stock markets appeared generally unimpressed Friday in reaction to a concerted effort of not only giving a bunch of free money away, but also promising there's more where that came from. Indeed, and in my opinion, stock markets put in lack luster performances considering that was a pretty big card Bush played last week.
Why did this occur? The simple answer is because these measures simply won't work . The more complicated answer is in history. One aspect is biblical and the other just common sense. The first is from the bible. Please forgive me if this is not exact verse. ‘Do onto thy neighbor as one would have them do onto you'. Here, what I am referring to is the fact many unsuspecting Europeans and Asians are very upset American brokerages unloaded disproportionately high percentages of their toxic (subprime) waste on them, meaning good luck even selling them T-Bonds in the future. American brokers did this to get these loans off their books, because even though some other schmuck owned them through some sort of fund, failure here had the potential to impact a firm's working capital, which is exactly what you are seeing today from one corner of the world to the other. And the second thing to look at is what happened in markets historically, where we will start with a more recent stunner (you might be stunned by the result), and work through the rest of the material from there. Here, I am referring to the fact the credit cycle is exhausted, FOR REAL, and is perhaps best tracked for our purposes in terms of margin debt. (See Figure 1)
Figure 1
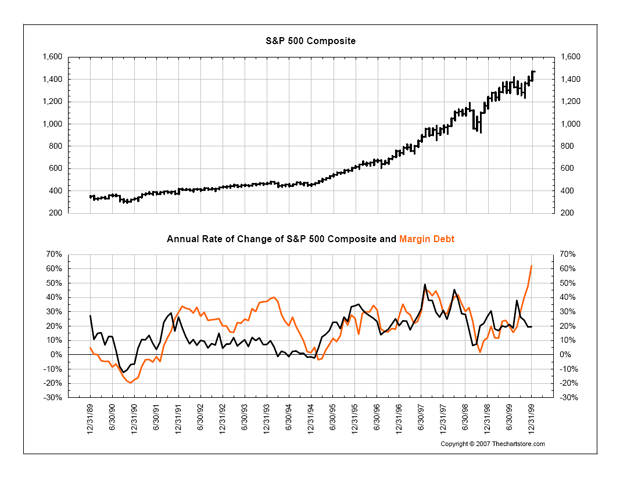
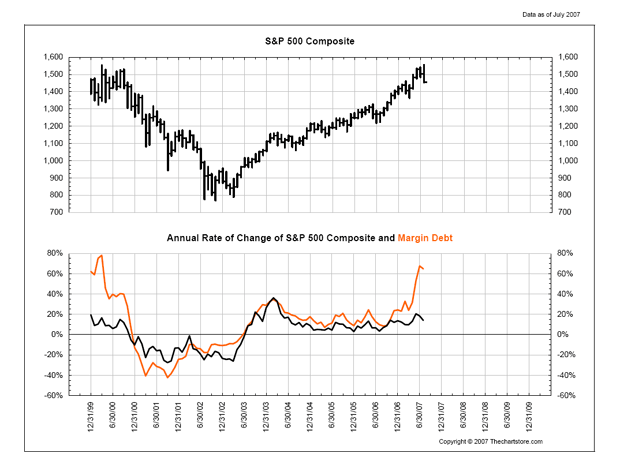
As you can see above, stocks generally continue to rise as long as the credit cycle, or more specifically margin cycle as it applies to stocks, is growing in healthy fashion. Such a sequence can be observed in the post '87 crash run taking stocks into a blow-off top witnessed in the year 2000. At the end, the Fed was worried about potential Y2K problems and flooded the system with money ahead of the turn at millennium. This provided the liquidity that fuelled the tech bubble in turn. What's more, it's important to note that at this time the system was in relatively good shape in comparison to today, where it didn't take much largesse on a relative basis to create this condition.
Today however, it's a different ball game, where just over the past month or so some half trillion dollars has been collectively added to European and US banking systems in addressing what is being termed ‘liquidity problems', which are in fact largely insolvencies. Combine this knowledge with the observation the rate of change in margin debt has recently shot up just like prior tops in stocks (like in 2000), and one must conclude this is not a good sign for stock market bulls. This is especially true because again, like in 2000, the rate of change in the S&P 500 (SPX) remains divergently depressed, meaning a very important ‘sell signal' has just been triggered. This is the most important technical observation that can be made with regard to the stock market's fate at present in my opinion. This is also why although there are conflicting signals that will be presented below, one must be extremely cautious in terms of your portfolio structure at present, as a significant ‘liquidity related event' in the stock market is now confirmed and not far off if history is a good guide. (See Figure 2)
Figure 2
And the Toxic Subprime Disaster is spreading like a disease, with even the oldest and most established banks in the world being infected. What's more, speculation is circulating a big bank is about to go bust. Based on this news then, it wouldn't be a bit surprising if it turned out to be Barclays. Talk this weekend in Jackson Hole about the credit collapse only affecting the shadow banking system is self-serving and disingenuous, especially coming out of the top German banker. First we have prominent banks in Germany needing a bail out, and now it's spreading to England , while these guys are still attempting Houdini tactics in having us look the other way. Logic would suggest it's only a matter of time before a big US bank finds itself in some real trouble. The problem in Western economies ( Japan included) is that purchasing power at the consumer level is gone. US manufacturing jobs are gone, and so is the work force's collective purchasing power. In the U.S. , purchasing power as measured by M1 has been contracting for some time, indicative of recession, or worse; but authorities hide this condition. What is worse? Answer: Deflation, and then depression.
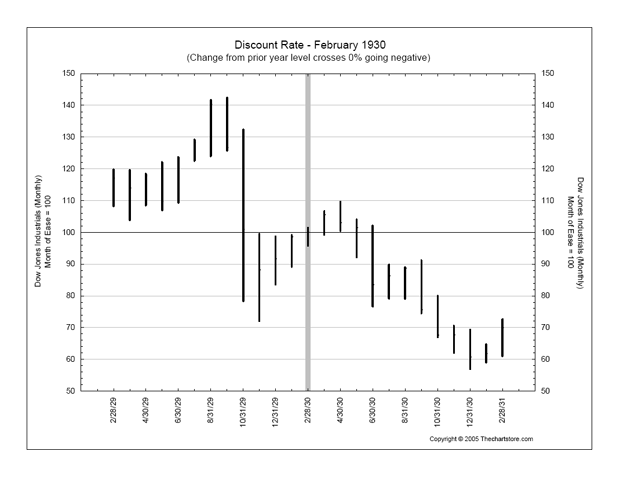
This is why while one can expect some kind of a pop in stocks later this month if the Fed cuts interest rates by at least a half-point, but don't expect the rally to last. At least that's the message presented in Figure 3 below, which is what happened the last time (1930) the US was in similar circumstances compared to present. Consumers were tapped after a credit binge in the 30's, just like they are right now, which is why even after initial interest rate cuts, stocks still kept falling (crashing) for a period of time. (See Figure 3)
Figure 3
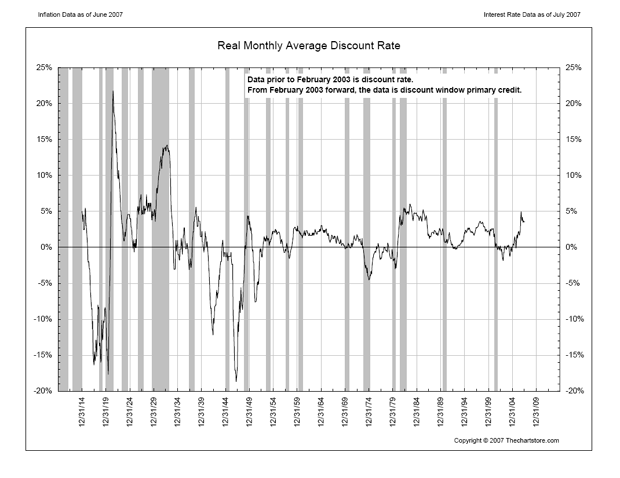
Further to this vein of thinking, this is why interest rates, both at the Discount level and to the consumer ( Fed Funds Rate ) will need to go negative in real terms before any noticeable / prolonged effect from interest rate policy should be expected. As you can see below, in attempting to fight the inflation bogy, real rates are a long way from being negative. (See Figure 4)
Figure 4
Where the Fed is going wrong here is it's attempting to fight commodity inflation based on growing demand originating out of Asia while ignoring it's own collapsing consumer. This is a recipe for a crash in equity values due to a non-responsive / misguided Fed. The implication here is it will take a ‘big hit' in the stock market before the Fed wakes up to the realization it's behind the curve in terms of lowering rates. And as mentioned above, even when rates are lowered, such policy will have a negligible effect for quite some time if history is a good guide. Again, and in terms of rates to the consumer, they had better hurry up because the Real Fed Funds Rate is a long way from being negative when measured using official inflation statistics . (See Figure 5)
Figure 5
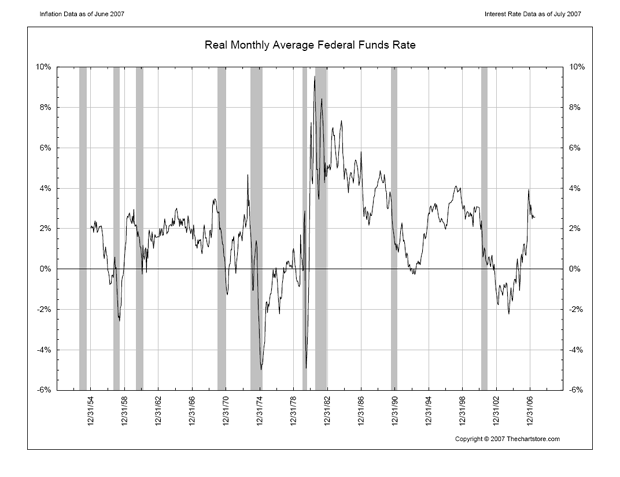
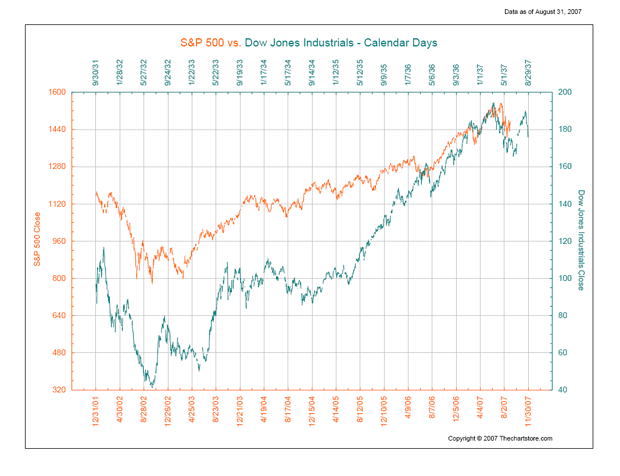
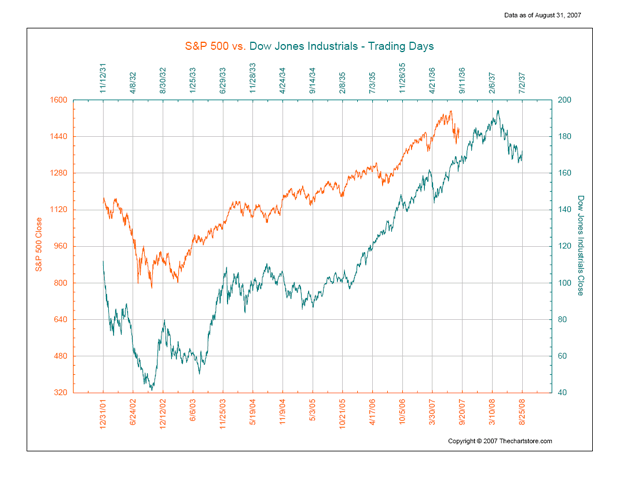
Of course if we were to use an inflation rate closer to reality , real rates would already be negative. But this exercise is based on measuring relativity, so we will not belabor this point. Just so you know however, if such figures were used, they would indicate the situation is far worse than official statistics are letting on; again, with actual real rates already negative. What's more, this is another ‘big reason' to be concerned about the stock market, because it means maintaining pressure in the pipe might prove difficult if other factors begin to unravel. With this in mind, below we present two analog based plots measuring the comparative trades patterns of the Dow from the 1930's and the SPX of today. If I had to pick between the two, the first one appears to be a better match, which in fact also matches Dave's thoughts on the trading pattern that should be expecting in coming days. Here, the bottom line is that after a lower high in the SPX is witnessed in coming weeks, if history is a good guide, stocks would peel-off approximately 50-percent in the following six-months. At least that's what happened to the Dow after it reached its echo-bubble crescendo in 1937. (See Figure 6)
Figure 6
And I would not characterize the other possible outcome as ‘good' either, where an extension of sloppy trade into next year would likely not provide us with the returns in our metals and energy related holdings we are anticipating at some point. (i.e. sizable intermediate degree gains.) Of course such concerns would not matter to us if we could make money on the short side of the stock market while we wait (hedging relating short selling / protective put buying), but being observant speculators we cannot short stocks, not with exiting short positions at historic highs along with monetization efforts accelerating. Here, it's the observant investor / speculator that's also ‘between a rock and a hard place', not able to ‘safely' invest / bet on either inflation or asset deflation at this particular time. (See Figure 7)
Figure 7
So, we wait and watch in this respect, where if things change over the next month or so, meaning renewed strength in stocks burns off a large part the collective short position in the market, we would of course reconsider our position at the time. Along these lines I do find it interesting some signs of a possible top in shorting activities are beginning to show up. But one must remember the golden rule in this respect. If the Specialists are not buying insurance, neither should you. Moreover, monthly candles appear quite bullish in predominantly all markets we follow. We witnessed some impressive reversals in August. Potentially unfortunate for the unobservant however, hidden in side the recovery in prices, 10-minute bars are counting higher in threes, suggestive all gains made in the second half of August will at a minimum be tested at some point in the not too distant future. Here, if the corrective process in stocks is to extend a ‘normal' amount of time, which often turns out to be 55 trading days, then we should see ‘round two' of the panic witnessed in July between now and mid-October. Stochastically speaking it's difficult not seeing bank stocks and financials breaking down further soon, closing right on trend line support in August.
We apologize, but we must reserve the rest for subscribers. This is of course not a problem if you like what you read below.
If this is the kind of analysis you are looking for, we invite you to visit our newly improved web site and discover more about how our service can help you in not only this regard, but on higher level aid you in achieving your financial goals. For your information, our newly reconstructed site includes such improvements as automated subscriptions, improvements to trend identifying / professionally annotated charts , to the more detailed quote pages exclusively designed for independent investors who like to stay on top of things. Here, in addition to improving our advisory service, our aim is to also provide a resource center, one where you have access to well presented ‘key' information concerning the markets we cover.
On top of this, and in relation to identifying value based opportunities in the energy, base metals, and precious metals sectors, all of which should benefit handsomely as increasing numbers of investors recognize their present investments are not keeping pace with actual inflation, we are currently covering 62 stocks (and growing) within our portfolios . Again, this is another good reason to drop by and check us out.
And if you have any questions, comments, or criticisms regarding the above, please feel free to drop us a line . We very much enjoy hearing from you on these matters, although we may not be able to respond back directly, so please do not be disappointed if this is the case.
Good investing all.
Captain Hook
Special Note: All images above provided courtesy of the Chart Store .
http://www.treasurechestsinfo.com/
Treasure Chests is a market timing service specializing in value-based position trading in the precious metals and equity markets with an orientation geared to identifying intermediate-term swing trading opportunities. Specific opportunities are identified utilizing a combination of fundamental, technical, and inter-market analysis. This style of investing has proven very successful for wealthy and sophisticated investors, as it reduces risk and enhances returns when the methodology is applied effectively. Those interested in discovering more about how the strategies described above can enhance your wealth should visit our web site at Treasure Chests
Disclaimer: The above is a matter of opinion and is not intended as investment advice. Information and analysis above are derived from sources and utilizing methods believed reliable, but we cannot accept responsibility for any trading losses you may incur as a result of this analysis. Comments within the text should not be construed as specific recommendations to buy or sell securities. Individuals should consult with their broker and personal financial advisors before engaging in any trading activities, as we are not registered brokers or advisors. Certain statements included herein may constitute "forward-looking statements" with the meaning of certain securities legislative measures. Such forward-looking statements involve known and unknown risks, uncertainties and other factors that may cause the actual results, performance or achievements of the above mentioned companies, and / or industry results, to be materially different from any future results, performance or achievements expressed or implied by such forward-looking statements. Do your own due diligence.
Copyright © 2007 treasurechests.info Inc. All rights reserved.
Unless otherwise indicated, all materials on these pages are copyrighted by treasurechests.info Inc. No part of these pages, either text or image may be used for any purpose other than personal use. Therefore, reproduction, modification, storage in a retrieval system or retransmission, in any form or by any means, electronic, mechanical or otherwise, for reasons other than personal use, is strictly prohibited without prior written permission.
Captain Hook Archive |
© 2005-2022 http://www.MarketOracle.co.uk - The Market Oracle is a FREE Daily Financial Markets Analysis & Forecasting online publication.


