


Gold Serious Negative Divergences Despite Recent Rally
Commodities / Gold and Silver 2010 Aug 07, 2010 - 04:01 PM GMTBy: Merv_Burak

 Gold has had several days of steady upside action but unfortunately the strength or momentum behind the move is not all that encouraging. Serious negative divergences are seen in my momentum indicators and need to be nullified before any significant move can continue. Let’s see where we are on a continuing basis.
GOLD
LONG TERM
From the long term standpoint the new long term P&F chart (discussed a few weeks back) is still in fine shape with the action continuing inside the up trending channel shown at the time. Gold still needs to hit $1110 before this P&F chart turns bearish so for now we are still in a long term bull market per the P&F chart. Now, what about our bar chart and normal indicators?
A couple of weeks back gold did move below its long term moving average line but quickly recovered and once more remains above the line. Throughout, the line has remained in an upward slope. As for the momentum indicator which is used to suggest the strength of recent price activity (relative to the time period under consideration) it has remained in the positive zone for these past few weeks. However, the indicator did react lower a couple of weeks back and almost dropped below its level shown during the low of last Feb. This seems to suggest that although the momentum is positive it is weaker than during its earlier period. Weakening momentum is too often an early warning sign of a possible price reversal. Must keep an eye on this. The momentum indicator is once more trending higher and is above its positive trigger line but as mentioned, it is weaker than earlier periods. As for the volume indicator, despite the daily action (discussed in the short term section) the indicator continues to move near all time highs and remains above its positive sloping trigger line. On the long term the rating can only remain BULLISH.
INTERMEDIATE TERM
The new intermediate term P&F chart (again discussed a few weeks back) had gone bearish and remains so. It is projecting back to the Feb low so we’ll just have to wait and see how this works out. At the present time with the P&F action to date, we would have to wait for a move back into new highs, at $1275, before this P&F once again turns bullish. Hopefully there will be additional up and down activity giving us a lower reversal level.
The normal indicators are not in quite as bad shape as the P&F chart. Gold is still just slightly below its intermediate term moving average line and the line is still pointing downward. However, the momentum indicator has already crossed into its positive zone and is above its positive trigger line. The volume indicator had dropped below its trigger line for about a week with the trigger turning downward but in the past few days the indicator has once more moved above its intermediate term trigger and the trigger line is once more positive. With all that the best I can do, rating wise, is give the intermediate term a rating of – NEUTRAL. That could change real fast should gold climb a little higher and cross above its moving average line. The short term moving average line is still below the intermediate term line suggesting it is a little too early to call the intermediate term bullish yet.
SHORT TERM
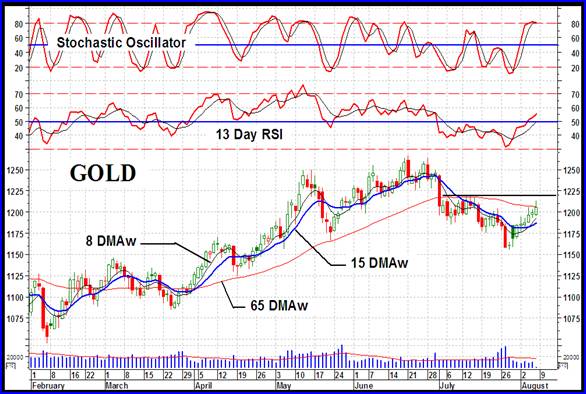
The short term is the time period looking the best. It is, of course, the period when one should expect to see new trends show up first. Gold has moved above its short term moving average line and the line has turned to the up side. The momentum indicator is inside its positive zone and above its positive trigger line. Only the daily volume action is a concern. Ever since gold turned and started to head higher the daily volume seems to have dried up. If this volume data is correct it is a concern as it implies that the speculators, those who move prices, are not too interested in getting in on the move. In April we had low volume, in June the volume was even lower and now in August it has dried up to almost nothing. Despite the price action, with volume so light one must be very, very cautious about the longevity of this up trend. On the chart we see a resistance level at about $1220 mark so one might expect the price to hesitate or even react from this level. However, putting the indicators together the rating can only be considered as BULLISH, at this time.
As for the immediate direction of least resistance, unfortunately that is not to the up side. The aggressive Stochastic Oscillator is suggesting we have reached a top by entering its overbought zone. It is in the process of turning back to the down side and one extra day of negative action and it will be back below its overbought line for a reversal warning. That and the fact that the price is getting very close to its resistance level suggests that we just might be in for some downside action in the days ahead.
SILVER
The silver P&F chart has been shown here on many occasions and shows a very strong support at the $17.50 mark. It remains above that level and is in an upward move so there seems to be no immediate danger of it hitting $17.00 for a downside break. Silver has been in a basic lateral drift for the past 5 months now and sooner or later something’s gotta give. We have a down trend line on our chart which would require a move to the $19 level to break above. Silver is above all of its moving average lines but the momentum indicators are reflecting weaker upside moves as time progresses. As with gold, this momentum has to improve before we can expect any serious upside move. We have a volume indicator that is reaching into new high territory (good) but the daily volume activity is very low (bad). Which will prevail only time will tell.
Looking at the Table of technical information we see that the recent activity in silver has been superior to that of gold but looking at the stocks this is only reflected in the speculative silver stocks. There is quite a difference in the performance of the speculative stocks versus the top 10 (quality) silver stocks. Go where the action is and that’s in the speculative side.
PRECIOUS METAL STOCKS
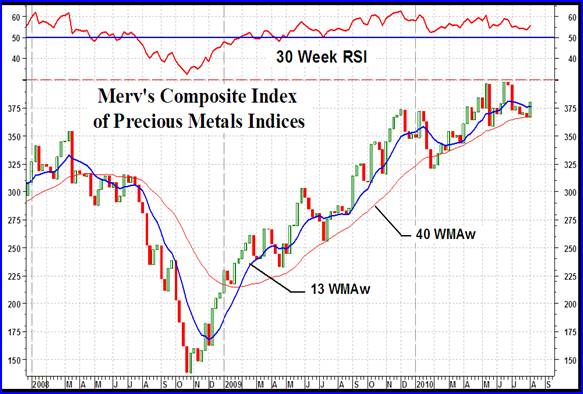
None of the major North American Gold Indices have been able to exceed their previous 2008 highs. However, the Merv’s Composite Index of Precious Metals Indices has moved well into new high grown. This reflects the performance of the various Merv’s Indices in the Table. The Merv’s Gold & Silver 160 Index (my overall universe) had reached 31% above its previous 2008 high while the highest quality Index, the Merv’s Qual-Gold Index had reached 15% above its previous 2008 high. The Merv’s Penny Arcade Index reached its previous high a year earlier than most, in 2007. It had reached a level 56% above that previous high and is moving close to new highs again.
Looking at the Composite Index chart (the component Indices that are included in this Composite are all of the Indices from the Table) several positive signs are quickly picked up. From the long term perspective the Index is above its long term moving average line and the line slope is still positive. The long term momentum indicator remains in its positive zone. We have a series of higher highs and higher lows since the bottom was reached in late 2008.
With those positives there are a few negatives that may not be as easy to spot. The moving average line has been in a turning process and is not all that far from turning negative. The momentum indicator has been giving us a negative divergence warning for months now. The higher highs and lows are getting more difficult to produce and in recent moves are barely into the higher high level. All this seems to suggest that the overall precious metals environment, although still positive, is heading for some problems ahead. How far ahead is not being announced so one must just be vigilant.
Merv’s Precious Metals Indices Table
Well, that’s it for another week.
By Merv Burak, CMT
Hudson Aero/Systems Inc.
Technical Information Group
for Merv's Precious Metals Central
For DAILY Uranium stock commentary and WEEKLY Uranium market update check out my new Technically Uranium with Merv blog at http://techuranium.blogspot.com .
During the day Merv practices his engineering profession as a Consulting Aerospace Engineer. Once the sun goes down and night descends upon the earth Merv dons his other hat as a Chartered Market Technician ( CMT ) and tries to decipher what's going on in the securities markets. As an underground surveyor in the gold mines of Canada 's Northwest Territories in his youth, Merv has a soft spot for the gold industry and has developed several Gold Indices reflecting different aspects of the industry. As a basically lazy individual Merv's driving focus is to KEEP IT SIMPLE .
To find out more about Merv's various Gold Indices and component stocks, please visit http://preciousmetalscentral.com . There you will find samples of the Indices and their component stocks plus other publications of interest to gold investors.
Before you invest, Always check your market timing with a Qualified Professional Market Technician
Merv Burak Archive |
© 2005-2022 http://www.MarketOracle.co.uk - The Market Oracle is a FREE Daily Financial Markets Analysis & Forecasting online publication.