Japanese Chart Pattern Could DOOM the DOW
Stock-Markets / Stock Markets 2010 Aug 12, 2010 - 12:03 PM GMTBy: INO
 "It's déjà vu all over again". Is one of Yogi Berra's famous original quotes and the same can be said for the DOW right now.
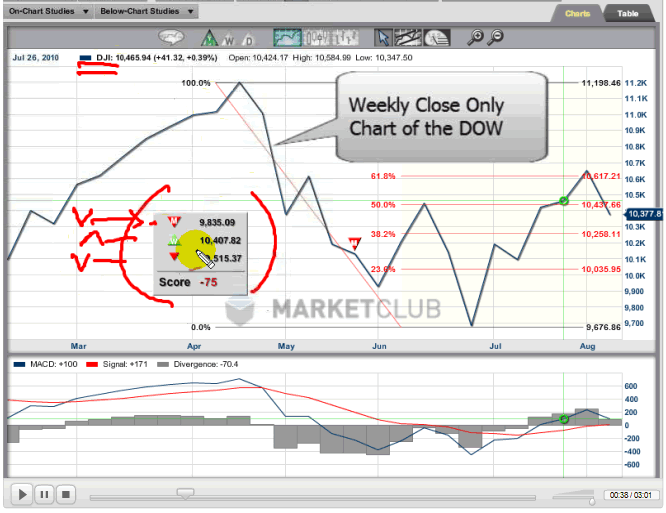
The weekly chart on the DOW is flashing the same Japanese candlestick signal that it had earlier in April of this year. Back then the DOW dropped from 11,200 to 9,700 in the space of just 10 weeks!
If nothing else watch this video as this could be one of the most important weeks for the DOW and its future. The video runs three minutes. You will find it both interesting and educational from both a Fibonacci and Japanese candlestick point of view.
Please feel free to comment on our blog with your thoughts on this market.
As always our videos are free to watch and there are no registration requirements needed.
Adam Hewison
President, INO.com
Co-creator, MarketClub
By INO.com
INO and Quote Providers furnish quotes and market analysis without responsibility for accuracy and is accepted by the site visitor on the condition that transmission or omissions shall not be made the basis for any claim, demand or cause for action. The information and data was obtained from sources believed to be reliable, but we do not guarantee its accuracy. Neither the information, nor any opinion expressed, constitutes a solicitation of the purchase or sale of any futures or options..
INO Archive |
© 2005-2022 http://www.MarketOracle.co.uk - The Market Oracle is a FREE Daily Financial Markets Analysis & Forecasting online publication.


