


Jakarta Stock Market Index A Leading or Misleading indicator?
Stock-Markets / Stock Markets 2010 Aug 14, 2010 - 06:36 AM GMTBy: Brian_Bloom

 Note to the reader: This article is not a treatise on technical analysis. It is an attempt to demonstrate how important it is to understand the nature and dimensions of the problems facing the world economy. The core issue has nothing to do with “money”. The core issue relates to waning supplies of energy to power transportation.
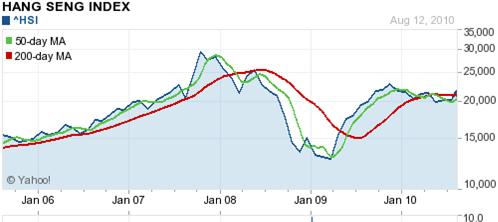
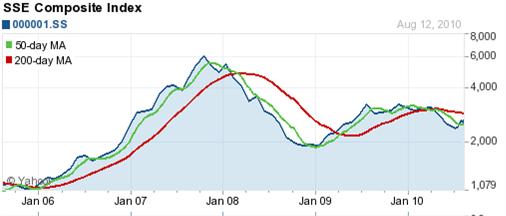
The series of charts below – courtesy Yahoo.com – tell an interesting story. Of the six, only the Jakarta composite is in New High territory. The others are all either showing Double Tops (potentially bearish) or are below their 2008 highs (actually bearish).
|
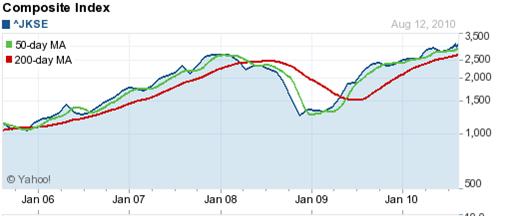
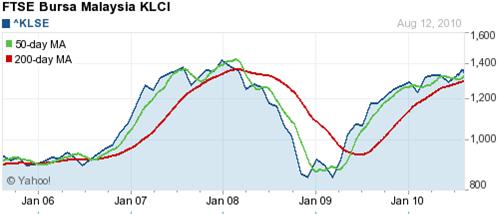
Chart 3 – India
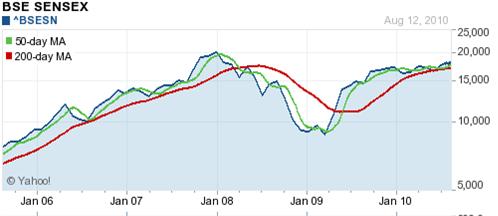
Chart 4 – Singapore
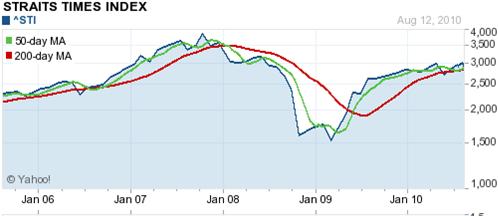
Chart 5 – Hong Kong
|
|||
Chart 6 – China
|
In the past few weeks this analyst has become bemused by the level of “angst” that he has been seeing on the charts as index prices have whipsawed above and below their 200 day Moving Averages, searching for direction.
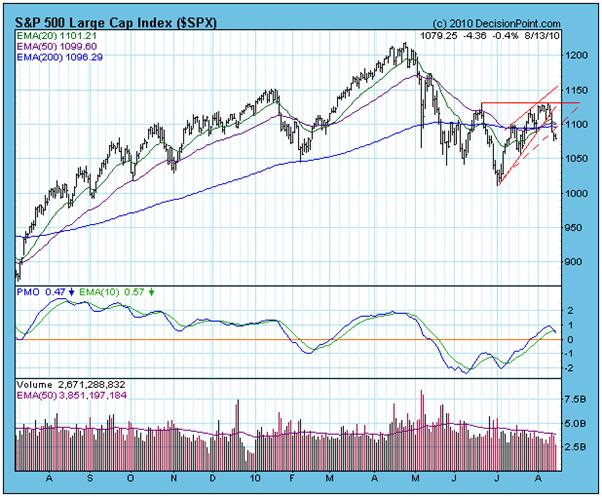
The following two charts illustrate this angst (Courtesy DecisionPoint.com). The first – of the Dow Jones Industrials – shows an Index slightly above its 200 day MA and the second of the S&P 500 shows the Index below its 200 day MA
Chart 7 – DJIA
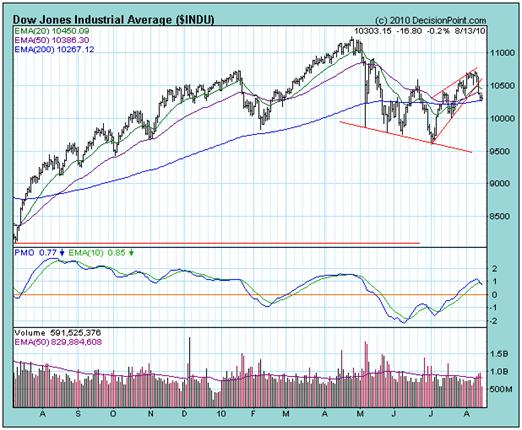
Chart 8 - $SPX
Analyst Comment
This analyst first came into contact with technical analysis in 1968. At that time, there were only a few commentators worth reading, the leading one being the Bank Credit Analyst of Canada. Most of the stock brokers in Johannesburg, where I lived at the time, had never heard of Technical Analysis. It was part of my job, as an employee of a newly established firm called Performance Charts, to sell them our hand plotted bar charts (on translucent semi log paper to facilitate Relative Strength Analysis) and our hand plotted Point and Figure Charts. Our sales pitch typically fell on deaf ears until we realised that it would be necessary to educate the brokers. My previous employer – Electronic Stock Evaluators – was the first in the country to apply a computer to stock analysis. Via ESE’s IBM 360 computer, we generated the Rand Daily Mail 100 Index on a daily basis and we created from scratch the ESE Indices, later to become known as the JSE Indices. We also calculated rolling moving average crossovers which we reduced to pluses and minuses for ease of analysis.
The reason I am relating this little bit of history is that it stands in stark contrast to the markets of today where everyone and his brother uses charts and computers to analyse the markets.
In those days, Richard Russell, whose work I also read fairly regularly, had discovered a problem which all technical analysts finally discover: When too many analysts are using the same analytical tools and are acting on the same chart signals, the patterns become self fulfilling. For that reason he developed his PTI (Primary Trend Index). From memory, it has eight components which, over the years, he has divulged – but at such intermittent intervals that only a dedicated student of his work will have the patience to wade through 40 odd years of his writing to discover what they are – and then everyone will have access to them and the PTI will become worthless.
I well remember being approached in the early 1980s by senior executives of a large Financial Institution who asked me whether I could help them develop a computer trading system.(I happened to be using Daan Joubert’s revolutionary program at the time – which he had had to put onto a Sirius, because the IBM PC could not handle the graphics). I tried to tell them about Primary, Secondary and Tertiary Trends but they were not interested. That stuff was too theoretical. They wanted a system that would scalp a few cents. Their objective was to trade large volumes. I walked away. At heart I am a manufacturer rather than a trader. I prefer to produce things.
Also in the early 1980s (maybe it was the late 1970s), Issy Bacher had got hold of a newfangled micro computer, the Apple McIntosh, and was using it to apply Joe Granville’s On Balance Volume techniques via a software program that he had commissioned. Joe had just come out with this brilliant new analytical tool which is based on a single simple idea: “Volume precedes price”. It worked well for a while and I worked with Issy on the side, helping him to establish his business – just to keep my hand in on the latest developments. But, when I saw how that program sought to take the “judgement” out of technical analysis, I became jaundiced. I already knew that when a newfangled technical tool is embraced it works brilliantly until it stops working. The reason is that, at the end of the day, technical analysis is an art, not a science. You cannot mechanise buy and sell signals and hope to make consistent profits. What happens, eventually, is that you become a Long Term Capital Management style investor. You become overconfident and you make massive bets with other people’s money until you get blown out of the water.
It’s great while it lasts but it’s really just a game of musical chairs. The last man standing makes a fortune. The other 99% eat humble pie, eventually. The trick is to know when to take your money off the table. The trick is to understand that “production” is what drives the economy, not “trading”. When England became a nation of shopkeepers, the British Empire went into decline. When the US became a service economy, the US went into decline.
So what’s the point? The point is that in today’s highly sophisticated market, stock market trading programs are two a penny. There are literally millions of people who believe that they are smart enough to earn a living by trading the markets. The result? The short term charts have become useless. It’s like trying to drill a hole into solid rock with a blunt drill. The more powerful the drill’s motor, the more smoke you generate. The hole doesn’t get any deeper.
But that doesn’t negate the concept of technical analysis. It just means that you have to be totally dedicated to the concepts of “Technical Confirmations” and to “Relative Strengths” and to understanding the relationships between Primary, Secondary and Tertiary trends and to validating your investment decisions with fundamental analysis, where possible.
In simplistic terms, “value” drives prices. That – not Elliott Waves - is what drives the Primary Trend. If the Primary Trend is pointing up, even an intellectual hunchback can make money. All you do is buy and hold. Of course, that formula is a recipe for disaster if the Primary Trend is pointing down.
“Perceptions of value” drive the Secondary Trends, In simplistic terms, in my day, what used to be the Big 8, now the Big 5 tended to drive perceptions. They were giving carefully researched (perhaps over-analysed) advice at Board level of large corporations and Board members were talking to newspaper journalists and “smart” people were reading the newspapers. The really smart people were networking amongst the board members. Everyone was telling everyone else what to think. When enough people climb onto a particular fashion bandwagon, perceptions change. The early adopters make a fortune and then sell out to the latecomers, who are fleeced. In the 1990s, the Big 8 advised everyone who would listen that “IT” was the place to be. A lot of money was made in IT. But it didn’t “drive” the economy.
“Herd Instinct” drives the tertiary trend. In simplistic terms, the Internet, TV and the daily newspapers are now driving both herd instinct and perceptions. There is too much information and, overlaid on top of this are the algorithm traders who have done deals to gain access to trading information a micro second before anyone else. In principle, this is nothing other than “Insider Trading” and the punishment for this insider trading should be a jail term. It is not clever to be one step ahead of the herd, acting on advance information that you are paying for. It is dishonest. The vendors of that information also belong behind bars.
So let’s get back to the above eight charts.
On a Relative Strength basis, Indonesia is the strongest of them all but, on a “Confirmation” basis, the fact is that the highs of 2008 have yet to be penetrated on the upside. Oceans of cash have been driving prices up – but not enough to change the direction of the Primary Trend. Value drives the primary trend of prices.
Fundamentally, the financial gurus of this world have convinced themselves that China holds the key to the future of the world’s economy but the FACTS are that:
- the Shanghai Index is showing a pattern of falling tops
- The Index is resting on its 50 day moving average
- The sideways pointing 50 day moving average is below the 200 day moving average
The FACT is that this pattern of indecision is being replicated across most markets.
Amongst all this noise, there is a one technical subtlety that strikes me: The PMOs of both the Dow Jones and the SPX are giving sell signals.
The questions in my mind are: What will drive the Primary Trend to new heights? Where will the value be created?
The answer I keep coming up with is: Until we get our energy infrastructure right, NOTHING will drive the Primary Trend upwards. Wealth will flow from one country to another. Some will get rich whilst others become poor. Net net, the pie will not grow and it might even shrink. At the end of the day, “energy” is what drives value add and value add drives economic growth. Therefore, without energy, there can be no economy.
Right now there are four primary sources of energy:
- Coal
- Oil
- Nuclear
- Natural Gas
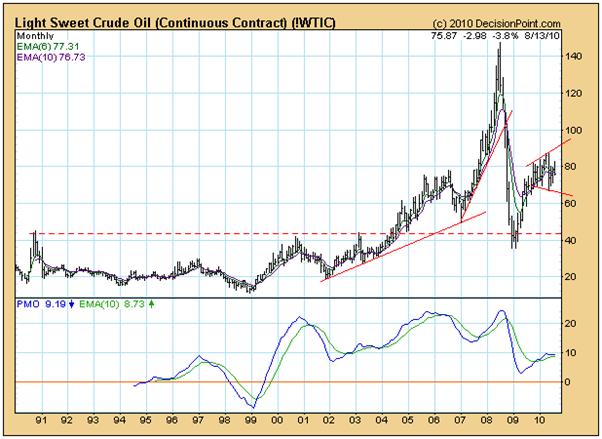
The chart below – of the price of crude oil – cannot be looked at as an economic indicator. The price of oil rose from $20 in the 1980s to around $80 a barrel today – largely because of two factors:
- Demand grew faster than supply
- The Us Federal Reserve printed too many dollars.
When you look at volumes, a very worrying picture emerges:
The following chart shows that world oil reserves in 2009 were 1,337 billion barrels (source: http://www.opec.org/opec_web/en/data_graphs/330.htm )
OPEC Share of World Crude Oil Reserves
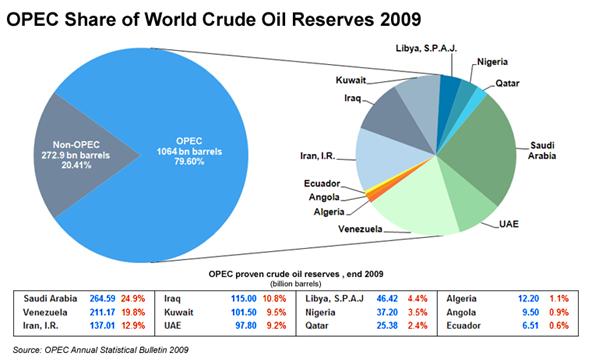
Of this, only around 30% is conventional oil
(Source: http://en.wikipedia.org/wiki/File:Total_World_Oil_Reserves.PNG )

A straight arithmetic conversion (assuming the above two statistics are correct) shows that world supplies of (low cost) oil are around 401 billion barrels.
The chart below shows that, in 2006, the total daily consumption of oil was around 85 million barrels. (Source: http://en.wikipedia.org/wiki/File:Oil_consumption_per_day_by_region_from_1980_to_2006.svg )

Assuming no growth if we divide the 400 billion barrels of supply by annual demand (84 million barrels a day X 365) you get:
13 years of supply of low cost oil remains underground.
Of course, we could argue that there are over 40 years of supply taking all oil into account and we could also argue that, via productivity we can keep put a lid on daily consumption.
Alternatively, we can stop kidding ourselves. The reality is that, from a transport perspective, the world is facing a massive challenge and, unless we address this challenge, it is going to become prohibitively expensive to transport goods and people from point A to point B. Economic activity will grind painfully downwards.
Which brings us back to the chart of the Jakarta Index.
Because there is, as yet, no sign of what is going to replace the internal combustion engine in motor car, trucks and ships and jet engines in planes, the Indonesian chart is not relevant. The world economy will not grow – yet.
Conclusion
At this point in human history, using technical analysis for the purpose of generating short term trading profits may be likened to rearranging the deck chairs on the Titantic. Right now, at this point in human history, the “finance” industry is just using up valuable oxygen. The purpose of capital is to invest in wealth creating activity – to finance the building of things. It was a potentially fatal error of judgement on the part of the politicians (backed by the finance industry) to believe that they could stimulate demand.
What the world needs now is a new energy paradigm and the infrastructure to support the transportation technologies which will hang off this new energy paradigm. Unless we can get our heads around that, and pull our fingers out to make things happen, then the world economy will resume its contraction.
Can we do it? Yes we can. But not with the likes of a Barack Obama at the helm.
The primary problem, sir, is “energy” to provide power for a new transportation paradigm. Everything else is incidental.
The secondary problem is that coal is a dirty technology which is highly inefficient – but that’s another story.
The Tertiary Problem is that supplies of natural gas are limited.
The world has to move beyond fossil fuels, beyond Neanderthal fire.
By Brian Bloom
Once in a while a book comes along that ‘nails’ the issues of our times. Brian Bloom has demonstrated an uncanny ability to predict world events, sometimes even before they are on the media radar. First he predicted the world financial crisis and its timing, then the increasing controversies regarding the causes of climate change. Next will be a dawning understanding that humanity must embrace radically new thought paradigms with regard to energy, or face extinction.
Via the medium of its lighthearted and entertaining storyline, Beyond Neanderthal highlights the common links between Christianity, Judaism, Islam, Hinduism and Taoism and draws attention to an alternative energy source known to the Ancients. How was this common knowledge lost? Have ego and testosterone befuddled our thought processes? The Muslim population is now approaching 1.6 billion across the planet. The clash of civilizations between Judeo-Christians and Muslims is heightening. Is there a peaceful way to diffuse this situation or will ego and testosterone get in the way of that too? Beyond Neanderthal makes the case for a possible way forward on both the energy and the clash of civilizations fronts.
Copies of Beyond Neanderthal may be ordered via www.beyondneanderthal.com or from Amazon
Copyright © 2010 Brian Bloom - All Rights Reserved
Disclaimer: The above is a matter of opinion provided for general information purposes only and is not intended as investment advice. Information and analysis above are derived from sources and utilising methods believed to be reliable, but we cannot accept responsibility for any losses you may incur as a result of this analysis. Individuals should consult with their personal financial advisors.
Brian Bloom Archive |
© 2005-2022 http://www.MarketOracle.co.uk - The Market Oracle is a FREE Daily Financial Markets Analysis & Forecasting online publication.