


ECRI Leading Economic Indicator Pointing to Double Dip Recession or Just Fine?
Economics / US Economy Aug 15, 2010 - 03:17 PM GMTBy: Mike_Shedlock

 Lakshman Achuthan and Anirvan Banerji, Co-founders, Economic Cycle Research Institute (ECRI), continue to pour out statements about the ECRI WLI that are worth taking a close look at, if not outright challenging them.
Please consider Know How to Read WLI.
Sir, “Out on a limb, the ECRI weekly leading indicator ... suggests a double-dip recession is imminent,” according to James Mackintosh (The Short View, August 4). This is a popular misconception pushed by pessimistic pundits.
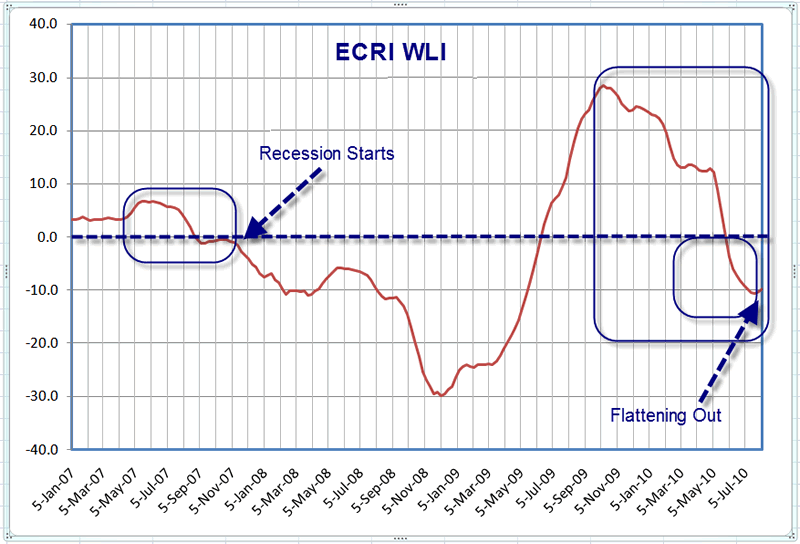
Let’s review what the Weekly Leading index (WLI) has done this year. After rising to a two-and-a-quarter-year high by end-April, it plunged for all of two months – before flattening out and finally edging up to a six-week high by end-July. That’s hardly a recession signal.
Imagine flying in an aircraft that hits a huge air pocket and plunges 5,000ft in 10 seconds. That would leave you quite shaken up, but it doesn’t mean the aircraft’s about to crash – unless it keeps falling. That’s pretty much what’s happened with the WLI. Unless it turns down again and then keeps falling, it wouldn’t make sense to predict an imminent recession.
Many self-proclaimed experts have been back-fitting our data, looking at the WLI the wrong way, and screaming that the end is near. This is like people saying they don’t remember an aircraft dropping so fast and not crashing, while blaming the instrument makers for not trusting their own altimeter. Well, we do trust it. Bottom line, the gauge is just fine – as long as you know how to read it.
When there really is danger of an imminent recession, it will be signalled by a cyclical downturn in the WLI itself rather than its growth rate. But that hasn’t happened yet.ECRI WLI
When there is "danger" of an imminent recession by the ECRI's calls, history suggests we will have been in a recession for months. Nonetheless, one must be careful of "reading" indicators, especially when no one knows for sure what the hell it even consists of.
Instead, I would like to point out that two weeks of flattening after an enormous plunge to -10.8 is hardly worth calling "flattening". Let's see where the index goes from here before we talk about "flattening" after that unprecedented nosedive.
By the way, this is not like an airplane dropping then recovering. Please pay attention to the zero line. This plunge is more like an airplane hitting the earth and leaving a quarter mile long crater, only to have someone crow "Good News! The plane stopped falling."
Nonetheless, it remains to be seen whether or not we have a double-dip recession. I actually have the odds of a double-dip recession falling quite rapidly. Why? Because it is increasingly likely the recession that started in 2007 never ended.
Thoughts From "BC"
My friend "BC" pinged me with a few interesting comments about the WLI....
Since 1967, the current WLI growth rate plus annual change has never occurred without a recession being imminent or the economy already in recession. In every case, the stock market had begun a bear market averaging a decline of 38% peak to trough; but the average decline for years 11-14 of debt-deflationary secular bear markets has ranged from 40-45% to 65%.
The annual and 26-week rates of change for the SPX is set to turn negative in the coming weeks, were the self-similar pattern to repeat for the SPX in '00-'01 and '07-'08, and the Nikkei in '00-'01.
The annual change comparisons for the WLI become harder hereafter through May-June '11, with the WLI at early '98 levels.
Of course, from a strict statistical perspective, the six events do not qualify for a minimum number of events to be statistically significant.
Still, given the current implied private annualized GDP growth of 0% to -1.5% from money supply (after government), bank lending, personal income and spending, and weakening employment, private GDP is likely already at or near 0% or contracting again as of late Q2 or into Q3.All things considered, I happen to agree with Lakshman Achuthan that the "gauge is just fine – as long as you know how to read it". With that, I leave it to the reader to decide whether BC's comments or those from the ECRI provide the most meaningful intrepretation.
For more on the ECRI please see
- ECRI's Lakshman Achuthan Still Blowing Smoke
- ECRI Weekly Leading Indicators at Negative 9.8; Has the ECRI Blown Yet Another Recession Call?
Please bear in mind, I like the WLI indicator, especially in conjunction with other economic indicators. I just wish I knew what was in it. I also wish the ECRI's claims about its predictive capability and what it means were far more consistent.
By Mike "Mish" Shedlock
http://globaleconomicanalysis.blogspot.com
Click Here To Scroll Thru My Recent Post ListMike Shedlock / Mish is a registered investment advisor representative for SitkaPacific Capital Management . Sitka Pacific is an asset management firm whose goal is strong performance and low volatility, regardless of market direction.
Visit Sitka Pacific's Account Management Page to learn more about wealth management and capital preservation strategies of Sitka Pacific.
I do weekly podcasts every Thursday on HoweStreet and a brief 7 minute segment on Saturday on CKNW AM 980 in Vancouver.
When not writing about stocks or the economy I spends a great deal of time on photography and in the garden. I have over 80 magazine and book cover credits. Some of my Wisconsin and gardening images can be seen at MichaelShedlock.com .
© 2010 Mike Shedlock, All Rights Reserved.
© 2005-2022 http://www.MarketOracle.co.uk - The Market Oracle is a FREE Daily Financial Markets Analysis & Forecasting online publication.