


Two Ways to Protect Your Retirement Portfolio From a Falling Stock Market
Stock-Markets / Stock Markets 2010 Sep 02, 2010 - 09:58 AM GMTBy: Jared_Levy

 One of the oldest methods of protecting your retirement money is by spreading risk out among different stocks and sectors. While this may be a partially effective way of mitigating the risk of a major drawdown in your account, it does NOT ensure success. In fact, in a broad market sell-off, you may see several sectors moving lower at the same time, similar to what we've experienced over the past couple months.
That begs the question... what to do? The answer is simple...
Sell When Things Are Good or Scale Out of a Position
As a trader, controlling your greed, setting goals and being proactive can not only help preserve your regular capital, but your mental capital as well. Here's what I mean. Let's assume you bought the S&P 500 ETF (SPY:NYSE) at $107 on June 20, 2010; one week later, it is trading at $113 and the charts are looking shaky, not to mention the broad market is not very stable. At that moment, you could take some profits (you just made an annualized return of over 220%) by selling some or all of your shares. You could also sell covered calls against your stock. (Covered calls offer some protection and lower your cost basis.)
In either instance, not only would you have a winning trade that would increase the size of your account, but you would also have a sense of accomplishment and feel more confident when entering your next trade. Not to mention, you would have the capital freed up to do so. This proactive approach to trading is a necessity in today's uncertain financial markets.
Now let's look at the flip side and assume you don't sell because you had no profit goal established when you initiated the trade and you were feeling a bit greedy. So you decide not to sell but rather hold your long position. Just as above, the charts are shaky and a few days later, bad economic data hits the wires and sends the SPY sharply lower. In addition, the SPY gaps below the 200-day moving average of $111 (as it occurred on Aug. 10). What was support becomes resistance and your trade now becomes a loser.
At that moment you're beating yourself up for not exiting, stressed because your opinion of the stock may have changed and your account is in the red, not to mention you have 20% of your account tied up in the trade, which could have been used to buy a different stock that may have better prospects.
All of a sudden, hoping, wishing and praying are now your strategies of choice. You also may be reluctant to enter another trade for fear of repeating what you just did.
This is obviously an extreme example, but not out of the ordinary. In fact, I have seen this type of situation for years. The point is to have a trade plan, target goal and acceptable loss level in place before making a trade, and stay on top of your accounts and the news! When things are good, do something to protect them – it's NEVER better to sell when a financial market is tumbling and you are under duress.
If I am in a trade and the market or stock climbs higher and higher, I usually like to scale out of my positions, which reduces my investment risk. I also will use proceeds from some of my more risky strategies that I take profits on to finance my less risky bets in a market that has been climbing a wall of worry or is skittish. Be aware of your risk/exposure at all times. No one ever went broke taking profits.
There's another way you can spread out the risks and that's by making use of charts.
(By the way, investing doesn't have to be complicated. Sign up for Smart Investing Daily and let my fellow editor Sara Nunnally and I simplify the stock market for you with our easy-to-understand investment articles.)
What the Charts Tell Us
Chart patterns can tell you much about a stock. By examining the past history of a stock and its typical behavior, we can get a better idea of its trajectory moving forward. What is most important is that the chart shows us where we might want to place our stop-losses.
Even though there are many ships on the bottom of the sea, many more made it to port unscathed by using charts.
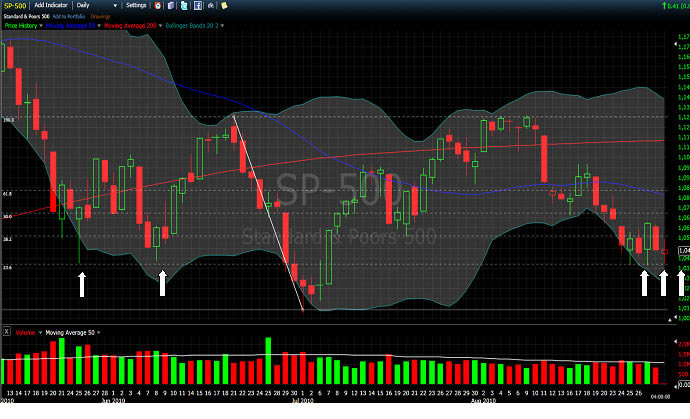
Looking at a candlestick chart of the S&P 500 (which is my favorite broad index, by the way), you'll notice a little dotted line that runs across the chart just above the white arrows. That line is what's called a Fibonacci retracement level (don't get scared, I'll keep it simple). Basically, Fibonacci was a brilliant Italian mathematician who lived in the Middle Ages. There is a sequence of numbers that is named after him and these numbers (or levels in this case) are a popular form of market analysis that many professionals use.
The current support level of 1,040 in the S&P coincides with a Fibonacci level and is considered by many to be major support for the index, which is why for the past week, the lows have been right at 1,040. You have to admit, that's a little more than coincidence. It could be that because many traders use the same indicators to buy and sell with, those levels that are created become self-fulfilling prophecies. It is pretty eerie sometimes how precise they can be.
The bottom line is if the S&P breaks below that level, we could sell off further, which is why you might want to consider setting a stop-loss just BELOW the 1,040 level (if you were invested in the S&P).
Don't forget to follow us on Facebook and Twitter for the latest in financial market news, investment commentary and exclusive special promotions.
Source : http://www.taipanpublishinggroup.com/tpg/smart-investing-daily/smart-investing-082710.html
By Jared Levy
http://www.taipanpublishinggroup.com/
Jared Levy is Co-Editor of Smart Investing Daily, a free e-letter dedicated to guiding investors through the world of finance in order to make smart investing decisions. His passion is teaching the public how to successfully trade and invest while keeping risk low.
Jared has spent the past 15 years of his career in the finance and options industry, working as a retail money manager, a floor specialist for Fortune 1000 companies, and most recently a senior derivatives strategist. He was one of the Philadelphia Stock Exchange's youngest-ever members to become a market maker on three major U.S. exchanges.
He has been featured in several industry publications and won an Emmy for his daily video "Trader Cast." Jared serves as a CNBC Fast Money contributor and has appeared on Bloomberg, Fox Business, CNN Radio, Wall Street Journal radio and is regularly quoted by Reuters, The Wall Street Journal and Yahoo! Finance, among other publications.
Copyright © 2010, Taipan Publishing Group
© 2005-2022 http://www.MarketOracle.co.uk - The Market Oracle is a FREE Daily Financial Markets Analysis & Forecasting online publication.