Leveraging Gold Investments with Silver
Commodities / Analysis & Strategy Jan 17, 2007 - 09:05 PM GMTBy: Robert_Watson
 If you have been a regular reader of the various precious metal websites, you will know that gold is the metal that dominates the discussion. This should not surprise us. Despite that fact that less than 2,500 tonnes of gold are mined out of the ground each year as opposed to the 20,000 tonnes of silver, it is market cashflow that matters and a look at the recent statistics of the international London bullion market shows that in November 2006, $12.1 billion worth of gold was cleared through that city as opposed to $1.41 billion worth of silver. Clearly, when it comes to business transactions as well as Internet chat, it is gold that talks louder than silver.
However, though the majority of those transactions will be for end products such as jewellery, it is the investment returns on gold and silver that are attracting increasing attention today. Investment demand for gold bullion is on the increase but so is the demand for investments that leverage the price of gold. One such class of asset are gold mining shares, others are gold futures and options. The other asset class we wish to publicise is silver.
It may seem strange to call silver a gold derivative but that is essentially what it is. It may have its own unique fundamentals that distinguish it from gold but by and large when gold goes up, silver goes up and when gold goes down, silver goes down. However, being a gold derivative, when gold goes up, silver goes up higher and when gold goes down, silver goes down lower.
So how much is silver a derivative of gold compared to say the HUI basket of unhedged gold stocks? To answer that question we need to define what we mean by leverage. For our purposes, leverage is defined as the greater return on investment an asset will produce compared to the asset it is dependent on over a given time period.
So, for example, if gold goes up by 10% in a four-week period but silver goes up by 20%, then the leverage silver gives over gold is positive at 2 (i.e. 20 divided by 10). If they both go up by 10% then silver is deemed to have offered zero leverage against gold at 1. If silver made only a small gain of 1% and gold made 10% then silver is offering a negative leverage of 0.1.
Note that the gold-silver leverage is not the same measurement as the well-known gold-silver ratio. The gold-silver ratio compares spot prices while the gold-silver leverage compares spot price changes. That price change is measured over a certain period of time and it is important to define the period over which we measure the leveraged return.
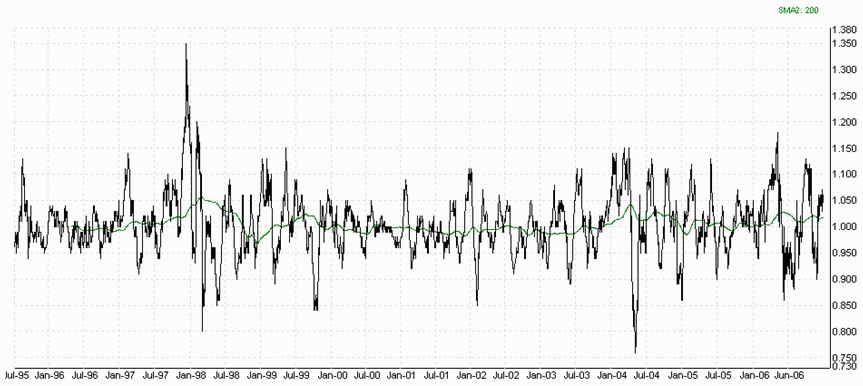
To demonstrate the point of choosing the right time period, we will display charts showing how silver has leveraged the price of gold over two different time periods. Firstly, we show the leverage of silver to gold over a rolling one-month period from June 1995 to December 2006.
Using the first point on the graph to explain the charting method, we divide the price of silver on the 12th July 1995 by the price of silver one month previously on the 12th June 1995. We repeat this procedure for gold. That gives us 0.95 and 0.99 respectively. Dividing the silver number by the gold gives us a silver leverage of 0.96. So our first point on the graph shows that silver was underperforming gold by four percent over that month.
By "rolling" I mean we roll on one day and repeat the one month calculation for the next two sets of days (13th June and 13th July 1995) and so on until the present day. Bring all these data points together and you have the graph below. The first thing we deduce from the chart is that the leverage of the silver to gold price over a month is essentially a random walk as prices oscillate around the zero leverage point by a few percent with the odd foray into the 10% to 20% region. In fact, the average over this 11 year period is 0.4% as the negative and positive leverages almost cancel each other out.
The big rise above 30% is the Buffet spike followed by the -20% drop when that mini-mania ended. We also note a sharp under leverage to gold when silver dropped dramatically from its April 2004 high of $8.50 to $5.50 in a matter of weeks. Apart from such rare instances, the performance of silver compared to gold offers no real investing advantage over such a short time period.

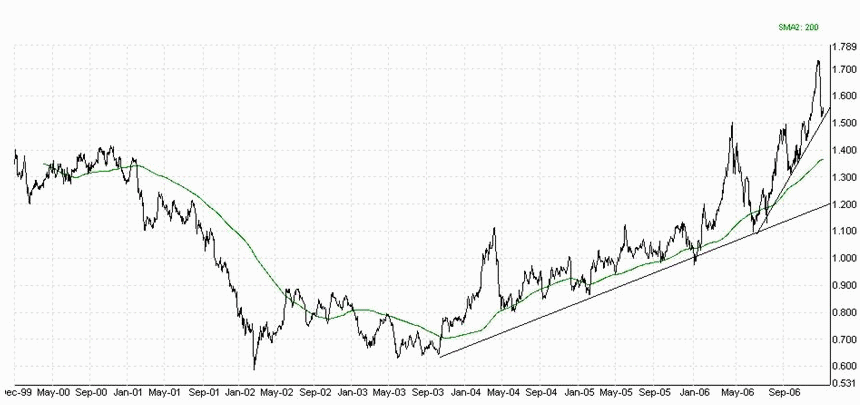
However, if we mimic the advice of the mutual fund managers who suggest that stocks should be held for at least several years before cashing out, what do we get if we ramp up the leverage period to four years?
In this case, the first data point is now the leverage on the price changes between the 12th June 1995 and the 11th June 1999 and the final data point is the price change between the 27th December 2002 and the 28th December 2006. This is a more sensible approach to take as most silver investors will be holding in the expectation that any bull market will be measured in years rather than months.
The chart is shown below and suggests a pattern that is not random in any way. Now we have a trend we can talk about and one that is rising! Note that from October 2001 until March 2005, the silver to gold leverage tended to stay below 1.00. This meant that over any given four year period, silver was underperforming gold and you would have been better off holding gold. However, for the clairvoyant investor (not many of them around), you would have strained your back loading up on silver when it hit a rock bottom leverage of 0.65 on the 2nd June 2003. At that time silver was still a bargain at about $4.54 an ounce.
Note further the V-pattern in this leverage chart. From a high of 1.6 on the 30th July 1999 (i.e. silver returned 60% over and above any gains made by gold over four years), silver eroded as leverage to gold until that bottom of 0.65 in June 2003.
The leverage from June 2003 has since risen to 1.54 today with a recent 7-year high of 1.73 back in early December. Let's put that in simpler language. Anyone who bought silver in early December of 2002 and cashed out in early December 2006 would have realised gains 73% higher than those realised by holders of gold bullion over the same period!

So note the first trend line I have drawn. Not only is silver outperforming gold, but also it is increasingly outperforming gold! If we extend that trendline it hits 1.80 at the end of 2010. However, we also have a faster trendline that began earlier this year that suggests 100% leverage on any return on gold by the end of 2007.
Which line will reign supreme? I say both. The slower one will be the overall trend and I believe it may be touched one more time but we can expect another steeper line such as the one above to finish off this bull market in silver and gold.
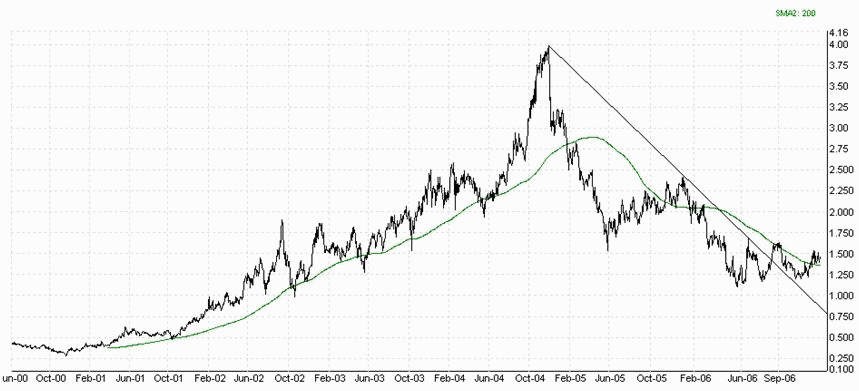
But you may be thinking: why should I invest in silver when I can get an even higher return from gold stocks? Well, how has the HUI basket of unhedged gold stocks been doing? If we apply the same leverage calculations and draw up a chart over our four-year rolling period we get the chart below.
Surprisingly, the HUI leverage has been doing the opposite of silver. While the leverage silver offers over gold has been rising since for the last two years, the HUI leverage has been dropping almost precipitously in the same period!
It is now at 1.45, almost the same as silver. That means that four years ago, somebody who invested in the HUI would now have the same return over gold as someone who held silver bullion! If there is no advantage in holding gold mining stocks, I know I would rather have held physical silver than shares in companies who are facing increasing political interference, rising infrastructure costs as well as the madder scramble for diminishing gold reserves.

Of course, those who invested more carefully in selected stocks will have boasted a higher return, but we are comparing two general asset classes here - physical silver versus top to mid-tier gold producers. One could show even higher returns in the junior sector, but we all know how risky that can be.
Indeed, looking at the HUI leverage chart, one could argue that we may now have a breakout above the descending trend of the last two years (see trendline). If that is true, then gold stocks may well outperform silver in the final leg of the precious metals bull market. However, we have yet to see a significant breakout above the 200-day moving average (displayed in green).
That is why diversification even in a precious metal portfolio is something every investor should consider. In terms of increasing volatility and risk, we have gold bullion, silver bullion, gold stocks and then gold futures contracts. For those who want to balance risk and leverage in their gold portfolio, silver should be seriously considered as a major component.
So, silver functions as leverage to the price of gold. This gearing to gold is increasing as the gold bull market heats up and I think will continue to do so until the final blow off. But how high can this leverage go? To answer that, one needs to analyse how silver leveraged the price of gold back in the last great bull of 1970-1980. We'll look at those numbers in the next issue of The Silver Analyst.
By Robert Watson
For the reader's information, this article is taken from the first issue of The Silver Analyst newsletter. Further details on obtaining this first issue free are below.
Further silver analysis can be obtained by going to our silver blog at http://silveranalyst.blogspot.com where readers can obtain the first issue of The Silver Analyst free. Comments and questions are also invited via email to silveranalysis@yahoo.co.uk
© 2005-2022 http://www.MarketOracle.co.uk - The Market Oracle is a FREE Daily Financial Markets Analysis & Forecasting online publication.


