The Stock Market Uncertainty Will End
Stock-Markets / Stock Markets 2010 Sep 07, 2010 - 06:53 AM GMTBy: Michael_Swanson
 Last week we saw the S&P 500 rally 6.4% off of its August low. Before that rally started the S&P 500 fell 8% off of its August high. And of course before that we saw a big rally in July, a big move down in June and the scary "flash crash" day in May. Despite last week's rally the market is still well off its April highs. It has spent the past few months going through scary drops and big rallies that have caused investors to swing quickly from fear to hope and back again.
There is nothing more exciting for the typical investor than to see the market rally big in a single day much less over the course of the week. Such rallies bring visions of further gains to come and ease their anxieties over past declines. They encourage them to keep holding what they have even if they have losses and to bet more on the market in the hopes that more gains will come.
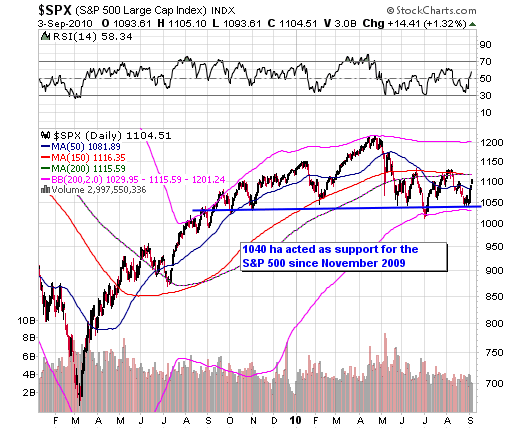
The wild gyrations we have seen the past few months need to be put in context with the longer-term chart of the stock market - which for almost a year now has simply been going sideways. Since October 2009 the stock market has basically gone nowhere. The rally in April to new highs was nothing but a fake out move that caused people who bought into it to lose a lot of money.

As you can can in the above chart the S&P 500 has been going sideways for almost a full year now. During this time the 1040 level has acted as powerful support for the market. It marked the support level of the most recent low. The equivalent level for the Nasdaq is 2100 and the 9700-9800 area for the DOW.
This sideways pattern is not going to continue forever and is likely to end one way or the other over the next few weeks.
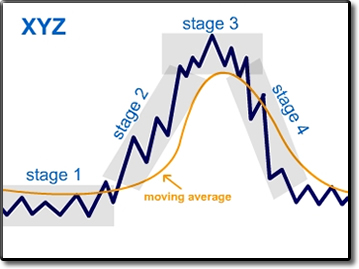
We have either seen the final low for the market for the rest of the year the other week or are right now are witnessing its last rally before it slips into a vicious full blown stage four bear market.

Markets go through stage two bull markets, stage three topping phases, and stage four declines. I define a bear market as one in which the market is below its long-term 200 and 150-day moving averages and those moving averages are acting as resistance and bull markets as the opposite. Since June the market averages have stayed below these moving averages in the classic bear market pattern.
If the market ends up breaking through its August lows over the next few weeks then we'll be able to look back and see the whole sideways pattern that has played out over the past 11 months as a massive stage three top. Huge and rapid declines would then ensue over the rest of the year and probably well into the first half of next year.
This is why the 1040 level on the S&P 500 is so important right now. I've been telling people I'm bearish on the stock market and that they should use rallies to lighten up on any lagging positions they have and have cash available to use at the end of the bear market. A few have listened to this advice but most have not - and some have been driven to anger by it.
But most people simply are unsure. During the big moves down they start to think of the bearish scenario, but then during the big rallies like we saw last week they worry that if they sell they could miss out on more gains or else they just think the market is bullish again.
This causes uncertainty. People just are not sure what to do.
Over the next few weeks the market is going to show us whether it is going into a vicious bear decline or is going to really get bullish again. If you pay attention you won't need to guess anymore.
If you recall at the beginning of the year I made a stock market forecast for 2010 in which I said that the stock market would go sideways for most of the year and that the sideways pattern would probably come to an end towards the end of the year.
One thing that I based this forecast on was the fact that the 200-day Bollinger Bands had grown so wide apart that they most likely would come back together again before the year is over. What happened is that the market went up so quickly form the March lows that there was almost no chance by the end of 2009 that the rate of that advance would continue. That meant the market would likely spend most of 2010 going sideways and prepare itself for another big move that could be up or down. I couldn't point to anything technical at the time that could predict which way the market would go at the end of 2010 but I felt for certain that the first half of the year at the least it would go sideways with just a bunch of fake out moves.
That is exactly what happened.
For the past few months though I have thought that we actually were slipping into a bear market.
Now what is key is that the sideways pattern is going to come to an end. The Bollinger Bands that were so wide apart back at the beginning of 2010 are now coming back together.
Although the swing have been violent the market is actually trading in a narrower range than it was six months ago.
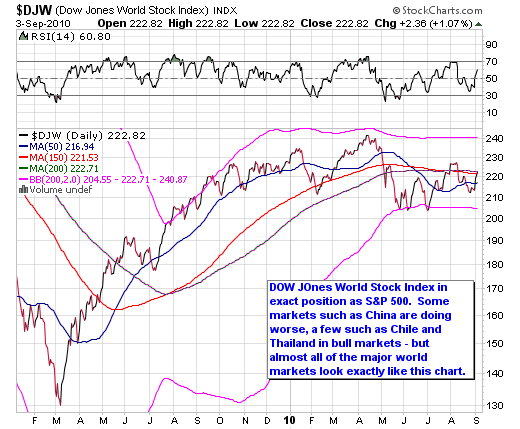
I don't see the current move as being sustainable and expect the market to pullback again once it comes to an end - no matter whether the market is going to be bullish or bearish. The market is now extremely overbought on a 60-minute chart and has stiff resistance at its 150 and 200-day moving averages. What is more practically every single stock exchange in the whole world is in exactly the same position.

None of these markets look like they are in a position to continue this current rally for weeks on end. The market does not not look like it did in July 2009. The sectors that make it up are too beat up overall to just blast off for the rest of the year.
The current rally could end at any moment, so buying into it at this point would be completely foolhardy. When the July rally peaked in August the market immediately took a nose dive practically overnight. This is what happens in bear markets. You get fast rallies that excite everyone, but then suddenly come to an end in a vicious trap.
The bullish scenario though for the market would be if it pulls back a bit after this current move and then simply goes sideways for 2-5 weeks and trades in an even narrower range. This would put it in a position where it would recharge itself and then start a rally sometime in October back up to its April highs. This would make the overall market look like it is bullish and starting a big bull leg up that would last into the end of the year.
However, if the bulls are right then any pullback after this current move up ends should be very short-lived. The market should not retrace no more than half of its gains and at this point should not revisit its August lows.
At this point those lows are that critical. If the market gets to its August lows over the next 1-6 weeks then I believe that it is simply going to go through them and start a vicious full blown stage four decline.
So if you are uncertain about the market at this point all you need to do is take action if the market averages get to their August lows. If this happens you should sell and take head. You should raise as much cash in your account as possible.
If you are bearish then you should do this now and if you want to be aggressive you should be short or look to short the current move in the market.
If the bears are right then this should be the last rally before the market turns down and falls apart. If the bulls are right then when this rally ends the market should not pullback much at all, but simply go sideways for 3-8 weeks before moving higher.
So you can stop feeling uncertain about the stock market. Just watch which one of these scenarios play out over the next few weeks and take action once it is clear to you what is happening.
This article continues in the WSW Power Investor members only section here.
By Michael Swanson
WallStreetWindow.com
Mike Swanson is the founder and chief editor of WallStreetWindow. He began investing and trading in 1997 and achieved a return in excess of 800% from 1997 to 2001. In 2002 he won second place in the 2002 Robbins Trading Contest and ran a hedge fund from 2003 to 2006 that generated a return of over 78% for its investors during that time frame. In 2005 out of 3,621 hedge funds tracked by HedgeFund.Net only 35 other funds had a better return that year. Mike holds a Masters Degree in history from the University of Virginia and has a knowledge of the history and political economy of the United States and the world financial markets. Besides writing about financial matters he is also working on a history of the state of Virginia. To subscribe to his free stock market newsletter click here .
Copyright © 2010 Michael Swanson - All Rights Reserved.
Disclaimer - WallStreetWindow.com is owned by Timingwallstreet, Inc of which Michael Swanson is President and sole shareholder. Both Swanson and employees and associates of Timingwallstreet, Inc. may have a position in securities which are mentioned on any of the websites or commentaries published by TimingWallStreet or any of its services and may sell or close such positions at any moment and without warning. Under no circumstances should the information received from TimingWallStreet represent a recommendation to buy, sell, or hold any security. TimingWallStreet contains the opinions of Swanson and and other financial writers and commentators. Neither Swanson, nor TimingWallstreet, Inc. provide individual investment advice and will not advise you personally concerning the nature, potential, value, or of any particular stock or investment strategy. To the extent that any of the information contained on any TimingWallStreet publications may be deemed investment advice, such information is impersonal and not tailored to the investment needs of any specific person. Past results of TimingWallStreet, Michael Swanson or other financial authors are not necessarily indicative of future performance.
TimingWallStreet does not represent the accuracy nor does it warranty the accuracy, completeness or timeliness of the statements published on its web sites, its email alerts, podcats, or other media. The information provided should therefore be used as a basis for continued, independent research into a security referenced on TimingWallStreet so that the reader forms his or her own opinion regarding any investment in a security published on any TimingWallStreet of media outlets or services. The reader therefore agrees that he or she alone bears complete responsibility for their own investment research and decisions. We are not and do not represent ourselves to be a registered investment adviser or advisory firm or company. You should consult a qualified financial advisor or stock broker before making any investment decision and to help you evaluate any information you may receive from TimingWallstreet.
Consequently, the reader understands and agrees that by using any of TimingWallStreet services, either directly or indirectly, TimingWallStreet, Inc. shall not be liable to anyone for any loss, injury or damage resulting from the use of or information attained from TimingWallStreet.
Michael Swanson Archive |
© 2005-2022 http://www.MarketOracle.co.uk - The Market Oracle is a FREE Daily Financial Markets Analysis & Forecasting online publication.


