What The Stock Market VIX Volatility Index May Be Telling Us
Stock-Markets / Volatility Sep 14, 2010 - 10:01 AM GMTBy: David_Grandey
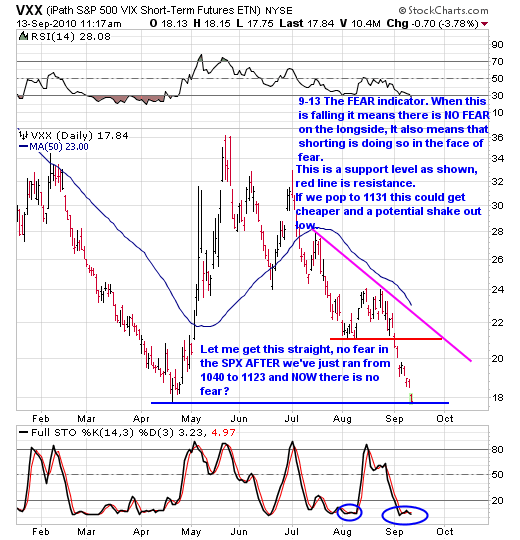
Take a look at the chart of the VXX, which is the volatility index or commonly known as the FEAR index.

What? I should buy stocks now?
The SPX has run 8% in 10 business days in September after a week where volume was the 3rd lowest of the year behind Christmas and Thanksgiving here in the States.
On top of that we see no good looking long side set ups to be had unless you like chasing buses and don’t mind buying extended stocks.
And finally, we have 6 outstanding set-ups on the short side setting up.
With the VXX it’s no wonder we are seeing more and more short sells setting up contrary to what the indexes are showing. This is how it works when you use the VXX as a guide.
By David Grandeywww.allabouttrends.net
To learn more, sign up for our free newsletter and receive our free report -- "How To Outperform 90% Of Wall Street With Just $500 A Week."
David Grandey is the founder of All About Trends, an email newsletter service revealing stocks in ideal set-ups offering potential significant short-term gains. A successful canslim-based stock market investor for the past 10 years, he has worked for Meriwest Credit Union Silicon Valley Bank, helping to establish brand awareness and credibility through feature editorial coverage in leading national and local news media.
© 2010 Copyright David Grandey- All Rights Reserved Disclaimer: The above is a matter of opinion provided for general information purposes only and is not intended as investment advice. Information and analysis above are derived from sources and utilising methods believed to be reliable, but we cannot accept responsibility for any losses you may incur as a result of this analysis. Individuals should consult with their personal financial advisors.
© 2005-2022 http://www.MarketOracle.co.uk - The Market Oracle is a FREE Daily Financial Markets Analysis & Forecasting online publication.


