Stock Market Caught in a Boundary Cycle
Stock-Markets / Stock Markets 2010 Sep 19, 2010 - 11:24 AM GMT The market at the moment is going through a “boundary cycle”. Believe it or not the range the Dow Transports is caught in is the range that was created by the flash crash of May 6th. (Dow 30: 10,800 – 9800). As I said immediately after this event it would take a while for the technical position of the market to repair itself and this has proven to be the case. Nothing coming from the SEC has proved that they have managed to deal successfully with the issue of Over The Counter High Frequency Quant Trading and until they do so we will continue to observe outright manipulation of individual equity and index positions. Modern market confidence will not be set on solid ground until HFQT is regulated or banned.
For the market to breakout from the current price band earnings results next month need to substantially beat expectations. With high unemployment, rising inflation and a weak dollar I am not sure this will transpire but we shall wait and see. Momentum-wise gold and silver ETF’s (GLD and SLV respectively) continue to trade well as do emerging markets and small caps. The movement of gold and silver is probably an indication that a second round of quantitative easing is almost a certainty thus ensuring that dollar weakness is set to continue.
It is interesting to not that the oil ETF: USO is trading very badly. If it breaks the 32 dollar price point it will be a definite technical sell. This seems very odd as commodities are supposed to be in “inflationary mode” on account of a falling dollar. This may indicate a weakening economic horizon and possibly falling GDP growth figures moving forward. The oil syndicates have a unique insight into real business sentiment. Do they know something they are not telling the rest of us?
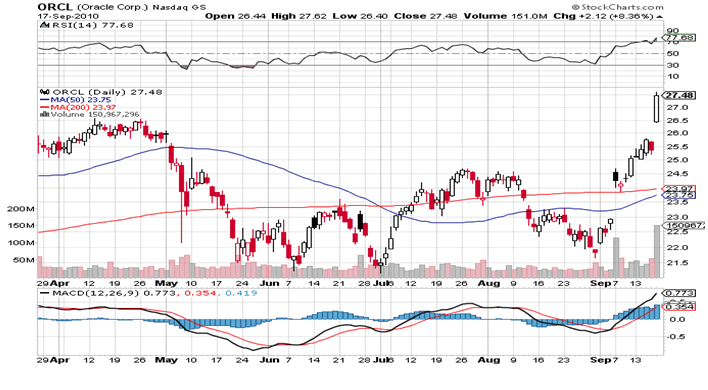
Technology is powering ahead particularly Oracle. This equity basically has been range bound for years. This was due to the fact that Larry Ellison was on a constant buying spree and was diminishing share price by constant share issuance in order to bank-roll his acquisitions. The recent momentum may indicate that this phase is over and the data base behemoth maybe ready to enjoy solid undiluted earnings growth.
Chart: Dow 30 Transport Index
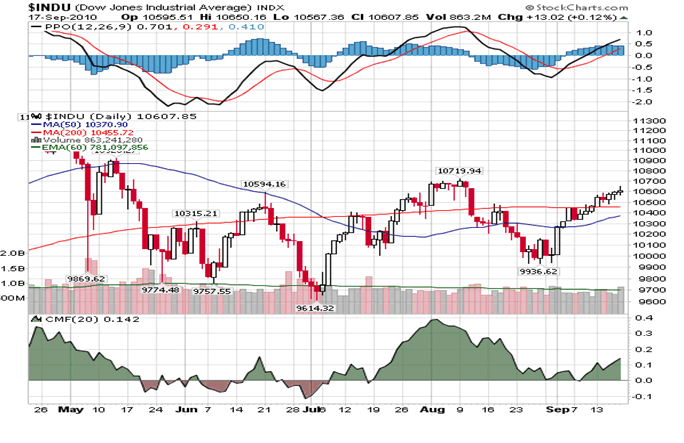
Chart: Gold ETF : GLD
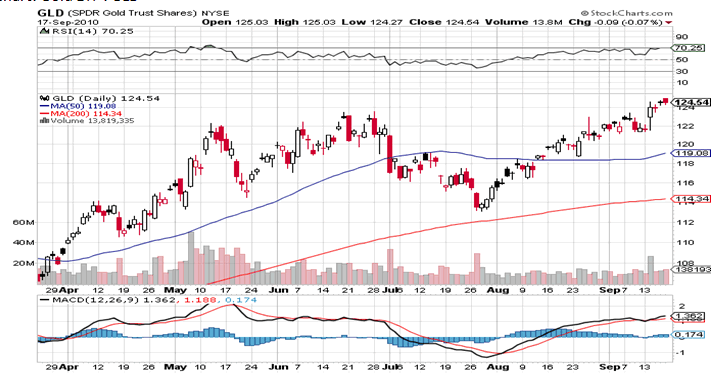
Chart: Silver ETF : SLV
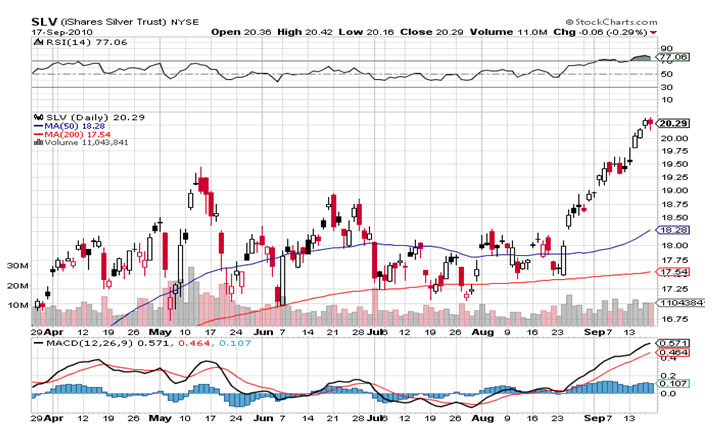
Chart: US Oil Fund ETF
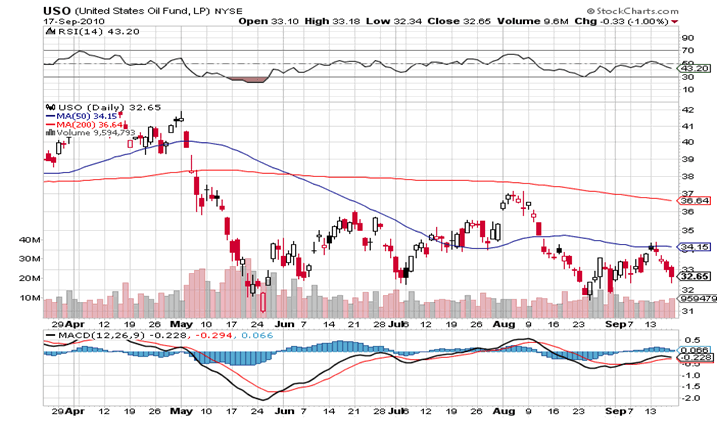
Chart: Oracle Corp.
By Christopher M. Quigley
B.Sc., M.M.I.I. Grad., M.A.
http://www.wealthbuilder.ie
Mr. Quigley was born in 1958 in Dublin and holds a Batchelor Degree in Accounting and Management from Trinity College/College of Commerce, Dublin and is a graduate of the Marketing Institute of Ireland. He commenced investing in the Stock Market in 1989. in Belmont, California where he lived for 6 years. He developed the Wealthbuilder investment and trading course over the last decade as a result of research, study, experience and successful application. This course marries Fundamental Analysis with Technical Analysis and focuses on 3 specific approaches. Namely: Momentum, Value and Pension Strategies.
Mr. Quigley is now based in Dublin, Ireland and Tampa Bay, Florida.
© 2010 Copyright Christopher M. Quigley - All Rights Reserved
Disclaimer: The above is a matter of opinion provided for general information purposes only and is not intended as investment advice. Information and analysis above are derived from sources and utilising methods believed to be reliable, but we cannot accept responsibility for any trading losses you may incur as a result of this analysis. Individuals should consult with their personal financial advisors before engaging in any trading activities.
Christopher M. Quigley Archive |
© 2005-2022 http://www.MarketOracle.co.uk - The Market Oracle is a FREE Daily Financial Markets Analysis & Forecasting online publication.


