


Gold Back to New Bull Market Highs, Though Lacks Momentum
Commodities / Gold and Silver 2010 Sep 19, 2010 - 07:09 PM GMTBy: Merv_Burak

 Well, we’re back into new bull market highs for the gold price but not for the momentum of the move. The strength of the move, although positive, is less than the strength of previous moves. Friday looked like a reversal day but anything can happen during the week-end to change that.
GOLD : LONG TERM
On the new long term point and figure (P&F) chart (see July 9, 2010 Commentary) gold has now made a new high and given us another projection. This break-out gave a projection to the $1395 level. The intermediate term P&F chart (the continuation of my previous long term chart) gave us a somewhat higher projection, to the $1500 level. We still have longer standing projections to the $1600 level which I would look at as the next major level to watch. Many analysts have already projected this level for gold (my projection was made several years ago when the bull was in its early stages). I have also previously mentioned a very long term projection to the $2575 level but let’s not get too ahead of ourselves. That may yet be a few years away, but who knows? For now let’s just focus on the $1395 level followed by the $1600 level.
As for the normal indicators, the price of gold is comfortably above its positive sloping moving average line. The long term momentum indicator is well inside its positive territory and above its positive sloping trigger line. However, the indicator is still below its levels from the June high which itself was below the level of the May high. This continuing weakening in the momentum of the move is something to keep in mind. It is, at the present time, a warning, but only that. The volume indicator remains in its all time high area but although gold made new highs this past week the volume indicator did not. It ended the week lower than its high from the previous week. Another warning, but again only a warning at this time. Putting everything together the long term rating at this point in time remains BULLISH.
INTERMEDIATE TERM
As mentioned above the intermediate term P&F chart (the previous long term one) has broken into new highs and has given us a new projection to the $1500 level. I would be more inclined to focus on the $1600 level from earlier projections. As for the normal indicators, those are also quite positive. Gold remains above its positive sloping moving average line while the momentum indicator continues its move inside its positive zone and above its positive trigger line. The volume indicator continues to move above its positive trigger line although as mentioned above, it does seem to be losing steam. In addition, we are into an intermediate term up trending channel (see short term chart). Still, putting the indicators together the only rating for the intermediate term, at this time, is a BULLISH rating. The short term moving average line continues to confirm this rating by maintaining its move above the intermediate term line.
SHORT TERM
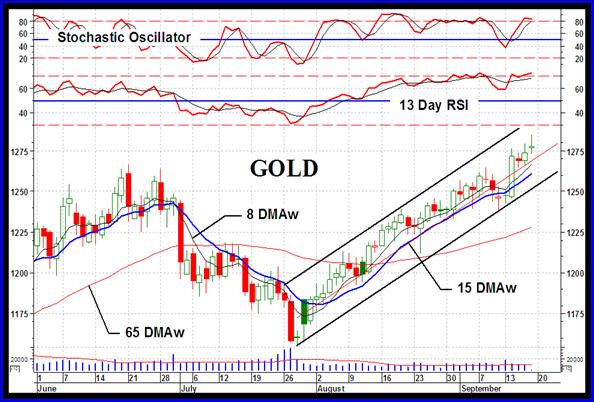
Looking at a short term chart gold has been on the move for about two months now. Time for a rest? The Friday action suggests that this may be the case although it is not a very strong daily candle to suggest so. I would have liked to see a larger space between the high and low but I’ll take what I got. Tuesday was a terrific day BUT there really was no follow through. That is worrying. One would have hoped for more than one good action day if the move had anything really behind it. In addition to the action on Friday we have the momentum indicators, the short term RSI and the Stochastic Oscillator. Both are in their overbought zones and although they could stay there for some length of time if the Tuesday move had anything behind it I suspect that both will quickly drop back below their overbought lines to indicate a reaction in progress. That may start on Monday or in a few days. A positive is the fact that since the bottom in late July the action has mostly been in the upper half of the up trending channel. Whenever the action dropped into the lower half it quickly reversed. The bad news is that ALL trends are sooner or later broken. When this one will be is anyone’s guess but at some point it will be.
So, what do the short term indicators tell us about the position of the market at the Friday close. Well, gold continues to move above its short term moving average line and the short term momentum indicator remains way inside its positive zone above its positive trigger line. The daily volume action remains low, below its average volume over the past 15 days. We need to see this volume pick up if we expect longevity in the gold up trend. For now the summation of the indicators gives us a BULLISH rating on the short term. The very short term moving average line confirms this rating by remaining above the short term line, where it has been since early Aug.
As for the immediate direction of least resistance, well the existing trend is still to the up side although it is losing strength. The Stochastic Oscillator is somewhat precariously positioned and could change direction on a day’s action. I will go with the lateral direction until the immediate trend is better confirmed.
SILVER
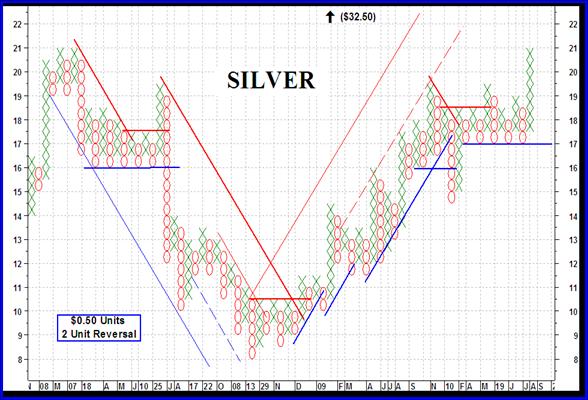
The silver P&F chart has been quite accurate over the past few years. It did, however, give us two whip lashes but those were only temporary. From the early days of this bull market move we still have a projection for the price to the $32.50 level with a lesser one at $24.50. The latest break-out gives us a $30.00 to $34 projection depending upon what one views as a consolidation zone. So, it looks like the lower $30s as a good bet.
This week silver moved back into the area of its previous highs from early 2008. It only needs another half dollar or so to get it into new highs. On the P&F chart, however, it needs to hit $21.50. Once more silver gave a superior performance versus gold this past week, a 4.9% silver move versus 2.5% for gold. In all three time periods silver is out performing gold. As far as silver stocks are concerned, that’s another story. The Merv’s Spec-Silver Index is going great guns and is one of the best overall performers in all three time periods. The “quality” stocks are not so good. The Merv’s Qual-Gold Index did make a new recovery high this week but is still some distance from breaching its all time high from 2008. It is the only Merv’s Index that has not yet moved in new all time high territory. So, if one wants to profit from the silver move one would most likely be looking at the more aggressive silver stocks rather than the biggies.
Everything on the charts suggest that silver is still in a strong trend. The volume indicator is solidly moving higher in new high ground, the momentum indicators are solid in their positive zones and the price remains well above its various moving average lines. The ratings for all three time periods therefore remain BULLISH.
PRECIOUS METAL STOCKS
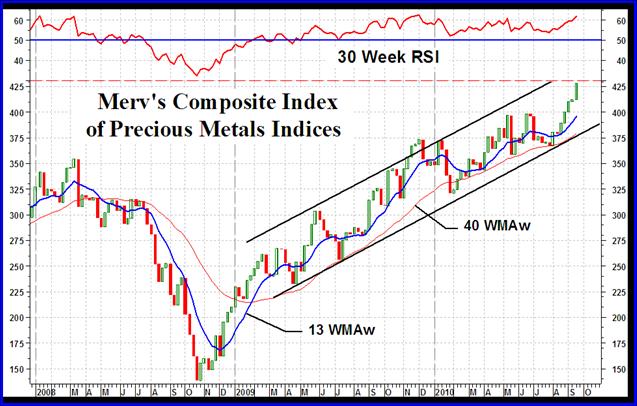
There has been some interest shown by readers of these commentaries in my Composite Index. Here it is again. This Index is a composite of all the components of the Precious Metals Indices Table posted here each week. An interesting chart when one compares it to the normal major North American Indices. Only the S&P/TSX Global Gold Index is in new highs and then barely so. The others are still below their highs reached in 2008. The driving force behind this Index is, of course, the various Merv’s Indices which are showing very good performances. As indicated in the previous section only the Merv’s Qual-Silver Index has not yet made new all time highs. The Merv’s Penny Arcade Index as an example is 80% above its previous bull market high, which occurred in 2007. The universe of 160 stocks, the Merv’s Gold & Silver 160 Index is above its previous 2008 bull market high by 48%. One starts to wonder about the validity of the major North American Indices where their performances do not seem to represent what is really happening in the industry.
This Composite Index had been a concern recently due to its long term momentum indicator under performing versus the performance of the Index itself. This underperformance suggested the Index moves were on lower and lower strength. The most recent indicator move suggests that strength is getting back to its previous high level and the concern may be significantly reduced. With the positive performances by the Merv’s Penny Arcade and Gamb-Gold Indices we can continue to look forward to a bull market in gold and silver stocks. There will be ups and downs along the way but as long as these two Indices are bullish then concern for the overall bull may be set aside.
Merv’s Precious Metals Indices Table
Well, that’s it for another week.
By Merv Burak, CMT
Hudson Aero/Systems Inc.
Technical Information Group
for Merv's Precious Metals Central
For DAILY Uranium stock commentary and WEEKLY Uranium market update check out my new Technically Uranium with Merv blog at http://techuranium.blogspot.com .
During the day Merv practices his engineering profession as a Consulting Aerospace Engineer. Once the sun goes down and night descends upon the earth Merv dons his other hat as a Chartered Market Technician ( CMT ) and tries to decipher what's going on in the securities markets. As an underground surveyor in the gold mines of Canada 's Northwest Territories in his youth, Merv has a soft spot for the gold industry and has developed several Gold Indices reflecting different aspects of the industry. As a basically lazy individual Merv's driving focus is to KEEP IT SIMPLE .
To find out more about Merv's various Gold Indices and component stocks, please visit http://preciousmetalscentral.com . There you will find samples of the Indices and their component stocks plus other publications of interest to gold investors.
Before you invest, Always check your market timing with a Qualified Professional Market Technician
Merv Burak Archive |
© 2005-2022 http://www.MarketOracle.co.uk - The Market Oracle is a FREE Daily Financial Markets Analysis & Forecasting online publication.