UK Debt Interest Spiral Time Bomb Explodes in August
Interest-Rates / UK Debt Sep 22, 2010 - 12:24 AM GMTBy: Nadeem_Walayat
 The UK government borrowed a record amount of £13.3 / £15.9 billion in August (public sector net borrowing requirement), which brings total public sector net debt to £823 billion, 56% of GDP (excluding financial interventions - bank capital injections) / £935 billion (including financial interventions) 64% of GDP, which puts the economy within touching distance of breaking above £1 trillion for December 2010.
Much of the mainstream press and academic economists fixated on Keynesian deficit spending ideology have been persistently criticising the new coalition government for its announced austerity measures which are aimed at getting a grip on the budget deficit before it sparked an out of control inflationary debt interest spiral as I have been warning of for the past 2 years (03 Dec 2009 - Britain's Inflationary Debt Spiral as Bank of England Keeps Expanding Quantitative Easing), where ever higher debt interest payments would increasingly take up a greater share of government revenues resulting in more debt added to the UK debt mountain and thus triggering ever higher debt interest payments the only response to which is for the government to print money to monetize the debt and thus push inflation ever higher as the country effectively accelerated on the path towards bankruptcy, perhaps the pseudo-economists aka journalists in the mainstream press should do some research on Argentina's debt history to see where this trend terminates!
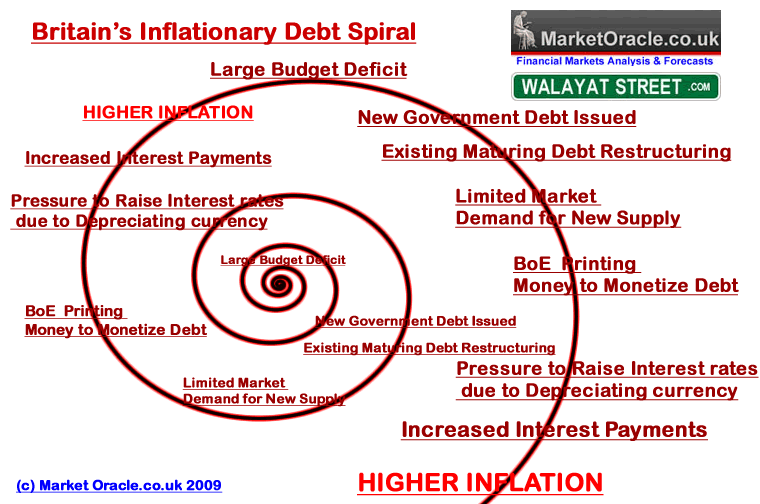
Those risks are now increasingly manifesting themselves which despite higher tax revenues due to a stronger than expected economy (by academic economists), the deficit continues to widen which now includes £3.8 billion of debt interest per month against £1.8 billion a year ago that annualises to £45.6 billion, up from approx £33 billion for 2009-10 and destined to double towards £70 billion by 2014-2015.
August's high debt interest rate payments was put down by the OBR to index linked government bonds due to the high RPI, which is why the government is scrapping measuring UK inflation in terms of RPI because, well it is a more accurate measure of UK inflation than CPI and that is not what the government wants, not when it is engaged in an inflation mega-trend to devalue total debt as covered at length in the 100 page Inflation Mega-Trend ebook (FREE DOWNLOAD). Off course the Bank of England despite all of its protestations of being surprised at persistently higher UK inflation during 2010 KNEW all along that high inflation was coming (13 Aug 2010 - The Real Reason for Bank of England's Worthless CPI Inflation Forecasts) , which is why the Bank of England staffs own pension fund during 2009 switched 70% of its fund INTO INDEX LINKED GILTS!
UK Public Sector Net Debt
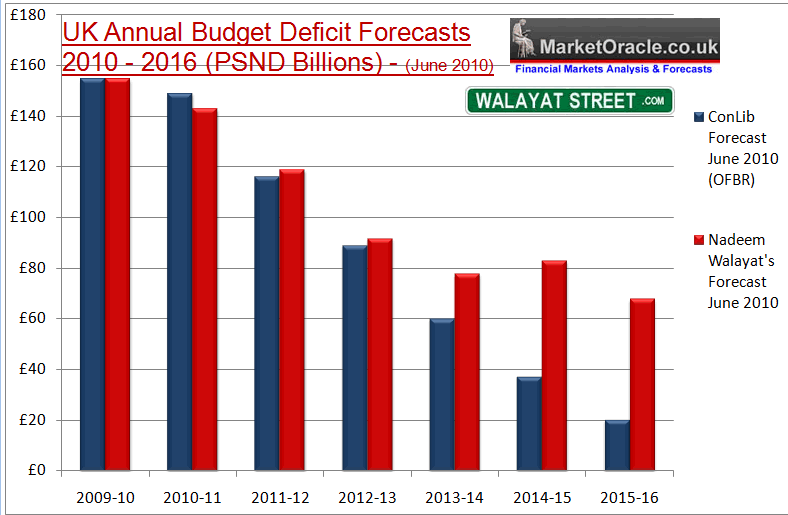
My In depth analysis in June (29 Jun 2010 - UK ConLib Government to Use INFLATION Stealth Tax to Erode Value of Public Debt ) took account of the governments emergency budget austerity measures that are due to start to come into effect during October 2010. The key conclusions were that even if the government were able to implement its planned austerity measures, total debt would STILL rise from £794 billion for 2009-10 to £1.242 trillion by 2015-16 (excluding financial interventions), or an increase of more than 50% as the government increasingly relaxed its austerity measures as the deadline for the May 2015 General Election draws near.
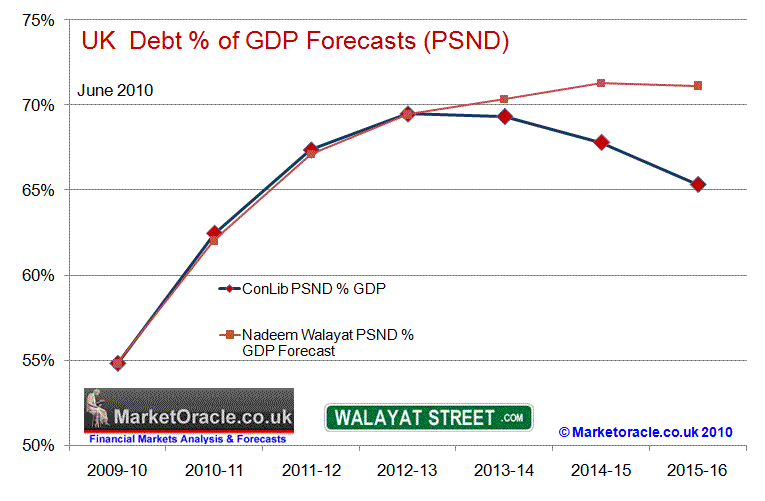
However where the debt interest burden is concerned there are two primary indicators that indicate the level of crisis that Britain faces, first is the public sector net debt as a % of GDP which suggests that UK public debt looks set to stabilising at approx 71% of GDP, or some 6% above the governments target.
And secondly debt interest as a percentage of government revenues where 2009-10 debt interest of £33 billion against revenue of £520 billion results in a debt interest burden of approx 6.5%. Given that government debt is expected to rise to an estimated £1.24 trillion by 2015, this will result in an annual debt interest burden of at least £60 billion despite the governments austerity measures to cut real terms spending and forecast economic growth (09 Aug 2010 - UK Economy GDP Growth Forecast 2010 to 2015 ), would result in a debt interest burden of at least 9% and possibly as high as 11% on higher market interest rates which illustrates the real danger the country faces from the consequences of the debt interest spiral as even after all of the austerity measures real terms debt interest payments by 2015 will still be substantially higher than today.
However as the two announced differing total debt figures indicate, real debt and liabilities are far higher than that which the government reports which continue to target approx £4.5 trillion by 2013-14, (as illustrated by the below graph which was last updated in May 2009), this is despite George Osbourne's emergency deficit cutting budget as a consequence of the recent projections for public sector pensions and increased european debt default risks. All of this is a sitting time bomb that will explode in the government bond markets which will send interest rates sharply higher as illustrated in the Inflation Mega-trend Ebook. The trigger for which could be a string of chain reaction European sovereign debt defaults, regardless of the new governments own programme for deficit reduction which still does nothing to actually halt accumulation of new debt.
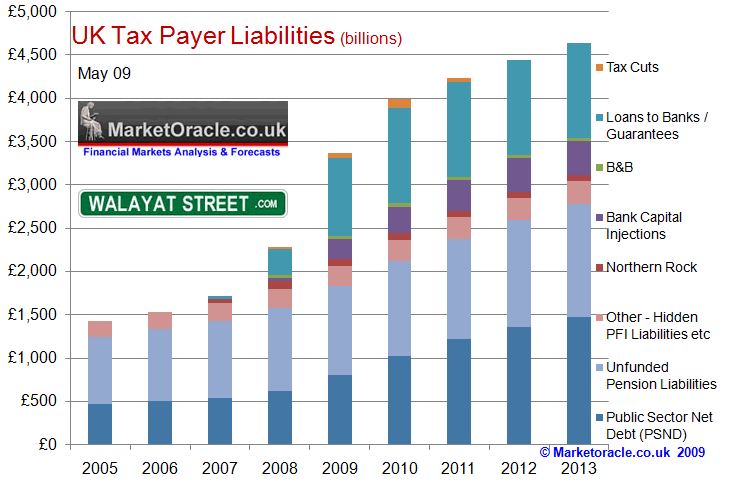
Wait, it gets worse as I have not even touched on private sector debt that totals an additional £3 trillion (that's not included in the Bankster bailout), which brings the total debt to about 500% of GDP, which makes the governments official debt statistics pretty much meaningless when considering the whole debt picture i.e. total public liabilities of 350% + Private Sector 200% against official public debt stats of 56% means the deployment of plenty of smoke and mirrors.
INFLATION
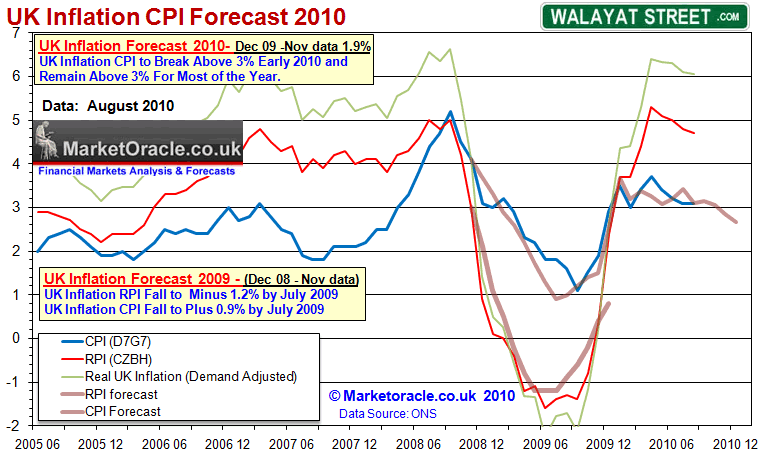
The ONLY answer to Britain's growing debt mountain and debt interest spiral remains for the country to try and inflate its way out of the debt crisis, which is illustrated by UK inflation continuing to trend above the Bank of England's upper limit of 3% despite 9 months worthless temporary inflation mantra and delusional deflation commentary in the press.
UK CPI Inflation at 3.1% for August 2010 is EXACTLY in line with my trend forecast for 2010 as of December 2009 that projected CPI above 3% inflation for most of 2010 and specifically CPI inflation of 3.1% for August 2010. My analysis since November has been warning of a spike in UK inflation as part of an anticipated inflation mega-trend (18 Nov 2009 - Deflationists Are WRONG, Prepare for the INFLATION Mega-Trend ) that culminated in the forecast of 27th December 2009 (UK CPI Inflation Forecast 2010, Imminent and Sustained Spike Above 3%) and the Inflation Mega-trend Ebook of January 2010 (FREE DOWNLOAD) as illustrated by the below graph.
In response to high inflation the government in July withdrew one of the few 100% safe defences against the governments inflation stealth tax, the NS&I Index Linked Savings certificates. The certificates paid RPI +1% resulting in an current tax free return of 6% per annum which is typically nearly triple the rate offered by the banks (after tax). This left the more advanced mechanisms for protecting your wealth such as investing in safe big cap cap dividend paying stocks, commodities such as oil and gold and silver and other fiat currencies that are expected to appreciate in the long-run such as the Chinese Yuan, Aussie Dollar are covered at length in the Inflation Mega-Trend Ebook (FREE DOWNLOAD).
Current in-depth analysis is under way on forecasts for the British Pound and UK Interest Rates, to receive these in your email in-box ensure you are subscribed to my always FREE Newsletter.
Comments and Source: http://www.marketoracle.co.uk/Article22886.html
By Nadeem Walayat
Copyright © 2005-10 Marketoracle.co.uk (Market Oracle Ltd). All rights reserved.
 Nadeem Walayat has over 20 years experience of trading derivatives, portfolio management and analysing the financial markets, including one of few who both anticipated and Beat the 1987 Crash. Nadeem's forward looking analysis specialises on UK inflation, economy, interest rates and the housing market and he is the author of the NEW Inflation Mega-Trend ebook that can be downloaded for Free. Nadeem is the Editor of The Market Oracle, a FREE Daily Financial Markets Analysis & Forecasting online publication. We present in-depth analysis from over 500 experienced analysts on a range of views of the probable direction of the financial markets. Thus enabling our readers to arrive at an informed opinion on future market direction. http://www.marketoracle.co.uk
Disclaimer: The above is a matter of opinion provided for general information purposes only and is not intended as investment advice. Information and analysis above are derived from sources and utilising methods believed to be reliable, but we cannot accept responsibility for any trading losses you may incur as a result of this analysis. Individuals should consult with their personal financial advisors before engaging in any trading activities.
Nadeem Walayat Archive |
© 2005-2022 http://www.MarketOracle.co.uk - The Market Oracle is a FREE Daily Financial Markets Analysis & Forecasting online publication.


