


Stock Market Update: Eyes of the Beholder
Stock-Markets / US Stock Markets Sep 30, 2007 - 02:16 AM GMTBy: Dominick
 Last week's update warned that “big moves are still out there, building just below the surface”, but they didn't really materialize in this mostly sideways week as Wall Street looked to dress up its balance books at the close of the quarter. Financials, for example, were untouchable on Friday after trading higher earlier in the week on a spurious rumor about Warren Buffet and Bear Sterns. Oh jeez, it's enough to make someone forget about the news and just trade the charts!
And, sure enough, in the midst of it all, that's exactly what we did – we found another scalper's paradise at TTC this week. Imagine knowing both sides of your intraday trade and being able to repeat the process over and over in a range bound market – that's exactly how we trade environments like this! A quick look at the chart below shows the important numbers we gave away last weekend, as well as a few that were available only to members, and how the S&P reacted to them all week – to perfection!
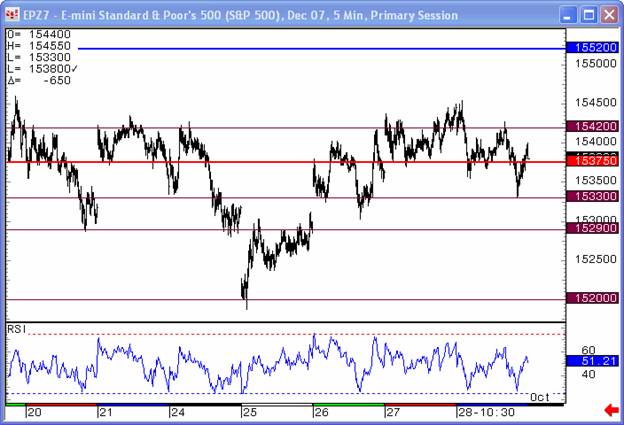
Having the chart below also stopped anyone from TTC into shorting where many others did. The S&P traded less than a point under our target in Tuesday's gap down, which became the low for the week.
I also said last week there were other markets reaching their tops and that these would be more interesting in the immediate future. Oil, for one, looks like it may have started showing some topping action at the end of the week, and both gold and the euro extended even higher, and closer to my ultimate targets which, of course, are only available to members.
But because scalping is nice, but you can lose your own head if you don't keep an eye on the big picture, we also watched “the squiggles and wiggles of the S&P” for the direction of the next big move, which I still believe is out there, just around the corner. But don't mistake that expectation for bias! Whereas I'm looking to trade the market in either direction, a bearishly biased trader interprets everything as a setup to sell – either because of an already established market position, or personal psychology. Whatever the reason, the market continues to climb its wall of worry, despite terrible news on almost all fronts, on the backs of these bearish traders.
And this week was no different. You don't have to look very hard, at least on the internet, to find the doom and gloom market crash scenarios. You probably know at least one person who loaded up on puts Friday and urged you to do the same. But what are these traders really seeing?
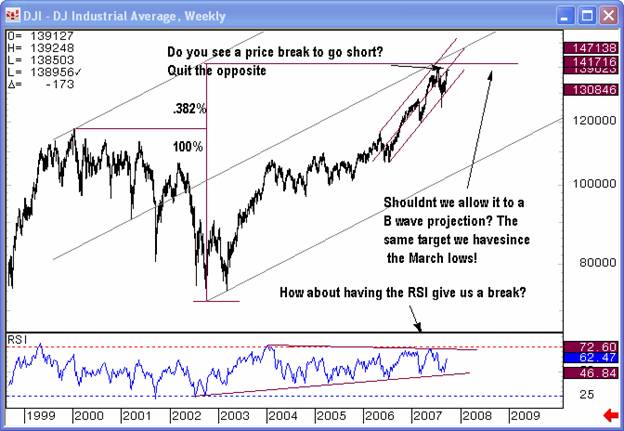
An unbiased analyst has to have some evidence. So it may be easy to say this week was all window dressing and that the market's tired after the rate cut rally and we're due for a correction, but other than all that anecdotal junk, where is the technical evidence to support buying puts? Certainly not in the weekly RSI. In fact, the chart above shows no price break to short and, to the contrary, suggests a move higher to at least the B wave projection, which is the most bearish viable count. And if this isn't a B wave rally, the target would be much higher. Does the price action really scream to go short, or is that a biased call?
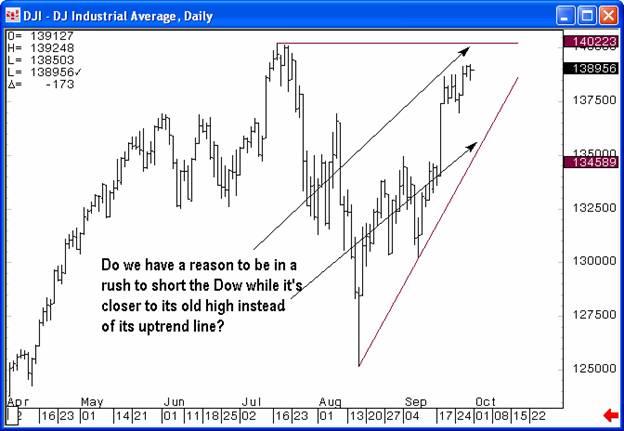
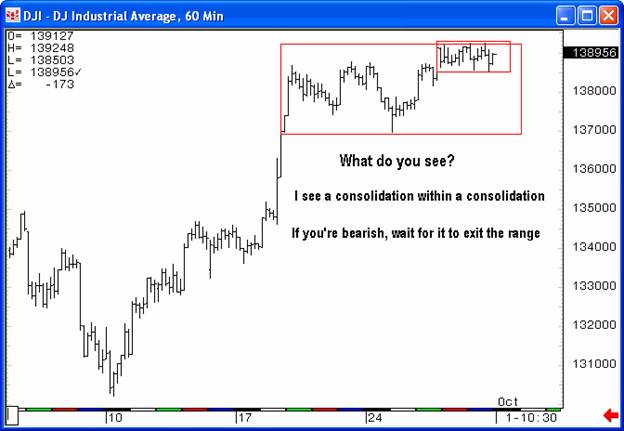
Shorting can be a dangerous game with unlimited loss potential. There's all kinds of different trading styles, but most people would rather short the break of an important upward trendline than a market closing in on record highs. But, maybe the doom and gloomers just don't see it that way – it often seems the bearish traders get the way they are because they focus on short term charts. Still, a 60-minute chart of last week's action in the Dow doesn't appear to signal a short either. The obvious, high reward/low risk trade for a consolidation within a consolidation is to wait for price to move out of the range, not to bet the farm on a hunch or a guess. Or a bias.
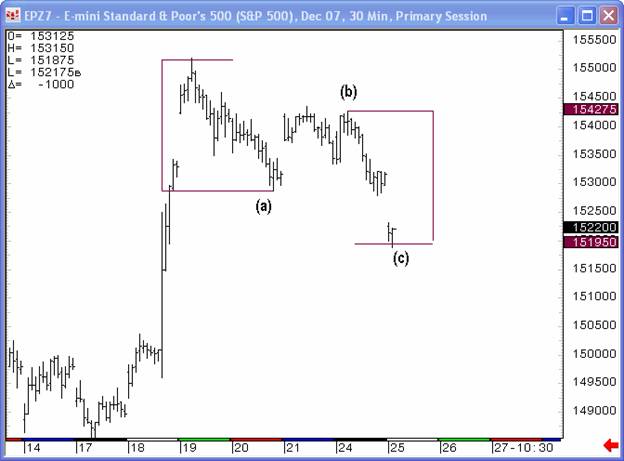
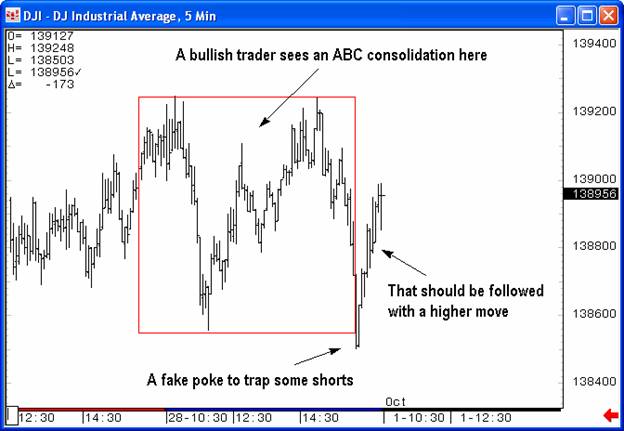
But, ultimately, the outlook for next week will be purely in the eyes of the beholder due to what I consider to be the Achilles' heel of Elliott wave analysis – there's always several ways to count a chart, but only one will be correct. The answer is to stay unbiased, which means to know all the Elliott wave rules and apply them meticulously so the charts do the talking, not your bias. Still, amateurs and – gasp, believe it or not – some professionals, continue to see want they want based on their positions in the market. Whereas I'm flat and ready to trade the real move wherever it may go, a bullish trader easily identifies an a,b,c consolidation, as illustrated in the chart below, with the bullish recovery appearing exactly as expected. And that's it.
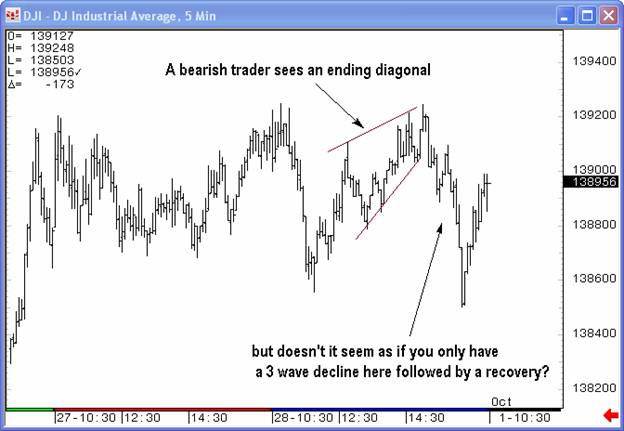
But a bearish trader just as easily sees an ending diagonal top and will permit nothing to alter this perception, or at least won't think twice before buying the puts.
I've refused to call an absolute top in this market and doing so has allowed my members to keep their heads, to stay unbiased and trade both sides of the market. And it's saved them lots of money by not shorting prematurely. So, the market may fall apart Monday morning, but we'll be there to trade it profitably while the perma-bears are making back some of their losses. Or, contrary to what everyone seems to be expecting, maybe we'll go up, and we'll be there to trade that, too. And that's the real beauty of unbiased trading – what an unbiased trader sees is their account growing week after week whether the market goes up or down.
Have a profitable and safe week trading, and remember:
“Unbiased Elliott Wave works!”
By Dominick
For real-time analysis, become a member for only $89
If you've enjoyed this article, signup for Market Updates , our monthly newsletter, and, for more immediate analysis and market reaction, view my work and the charts exchanged between our seasoned traders in TradingtheCharts forum . Continued success has inspired expansion of the “open access to non subscribers” forums, and our Market Advisory members and I have agreed to post our work in these forums periodically. Explore services from Wall Street's best, including Jim Curry, Tim Ords, Glen Neely, Richard Rhodes, Andre Gratian, Bob Carver, Eric Hadik, Chartsedge, Elliott today, Stock Barometer, Harry Boxer, Mike Paulenoff and others. Try them all, subscribe to the ones that suit your style, and accelerate your trading profits! These forums are on the top of the homepage at Trading the Charts. Market analysts are always welcome to contribute to the Forum or newsletter. Email me @ Dominick@tradingthecharts.com if you have any interest.
This update is provided as general information and is not an investment recommendation. TTC accepts no liability whatsoever for any losses resulting from action taken based on the contents of its charts, commentaries, or price data. Securities and commodities markets involve inherent risk and not all positions are suitable for each individual. Check with your licensed financial advisor or broker prior to taking any action.
Dominick Archive |
© 2005-2022 http://www.MarketOracle.co.uk - The Market Oracle is a FREE Daily Financial Markets Analysis & Forecasting online publication.