


Stock Market Top? The Bull & Bear of it!
Stock-Markets / Stock Markets 2010 Oct 03, 2010 - 12:20 PM GMTBy: JD_Rosendahl

 I've been calling for a top into the end of September 2010, and Thursday's gap higher and failure is a classic sign of potentially just that. That being said, there is still too many conflicting technicals currently.
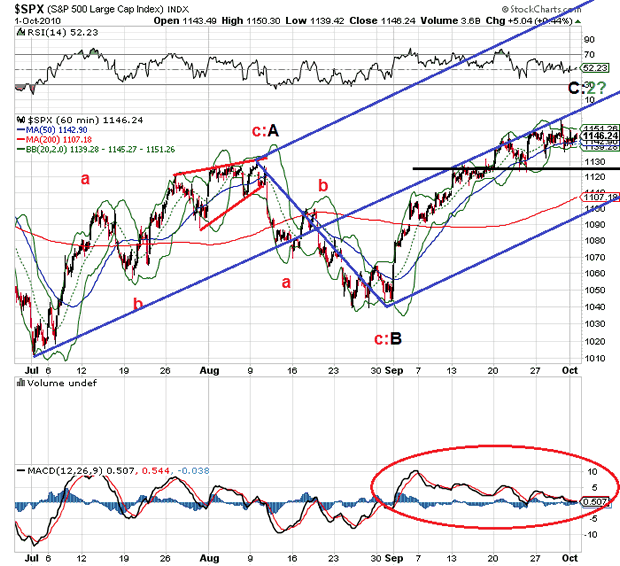
$SPX 60 Minute: I've put the bearish label on the 60 minute chart because it looks like a classic ABC pattern up. The MACD doesn't look terribly bearish sliding lower, so we could get another little push higher. So far, price has been held in check at the middle pitchfork line, but the RSI has room to support another test of overbought levels. Price needs to trade below 1,125 to increase the bearish view. That will also overlap with wave A.
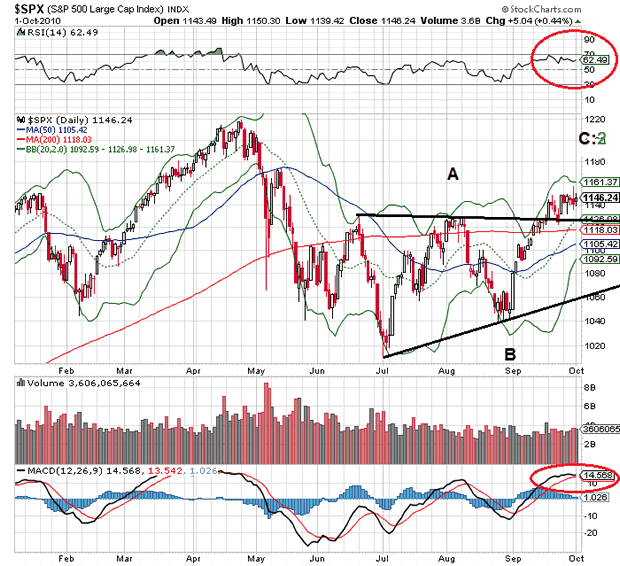
$SPX Daily: Here again I've labeled the bearish count. Price is above the neckline or support which is bullish. MACD is trying to roll, but it could still turn up if price has more upside. Price needs to roll over below 1,125 with the MACD to gain the bearish view.
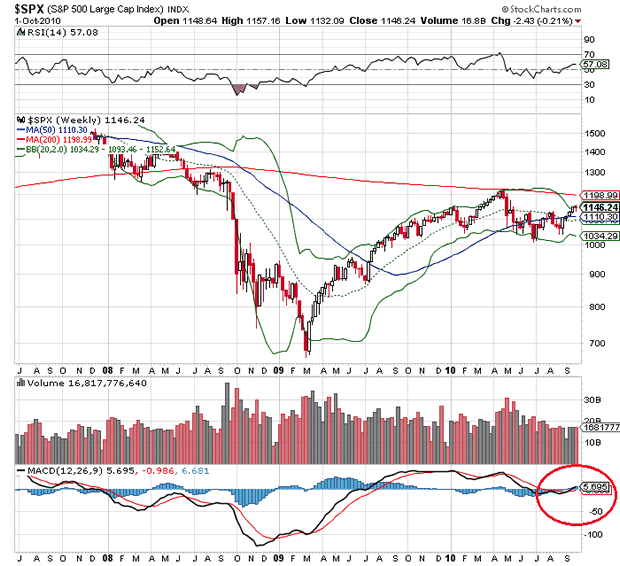
$SPX Weekly: Here's where the market looks more bullish. The weekly MACD has crossed and is heading higher. I've used the weekly MACD for intermediate signals many times, so we need to respect that the MACD is bullish. If so, 1,250 and 1,300 are potential targets.
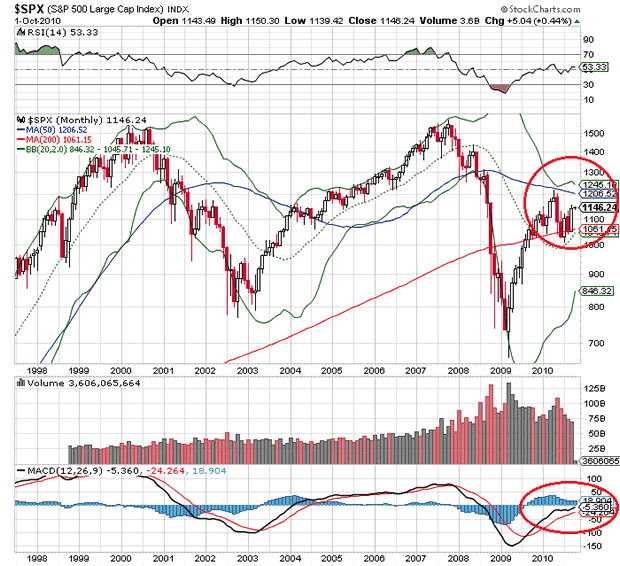
$SPX Monthly: Ditto the monthly MACD. It's grinding higher and hasn't even gotten to the zero line. It too looks bullish. The upper Bollinger Band is at 1,245, that's the first target is we continue higher.
$SPX Summary: The market is in No Man's land providing both a potentially short term bearish set up with longer term bullish indicators. The most persistently bearish Elliott Wave Analysts keep labeling every new high and wiggle up as the end of wave 2 and promoting the death spiral wave 3 to come. That may happen, but the technical's do not exactly support that currently. Simply, something needs to give.
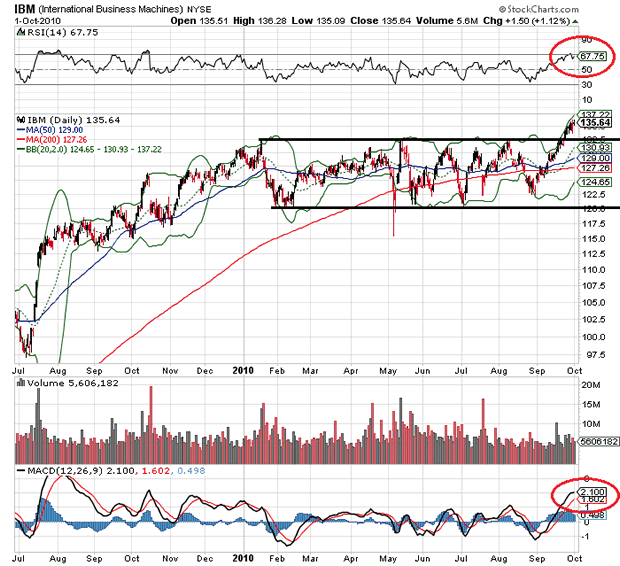
IBM: Big Blue continues to support the stock market. The MACD reflects a little more room for more upside before a roll over. Eventually, we should expect a back test of support, which may coincide with a market pull back. That being said, big blue's breakout is bullish for the market.
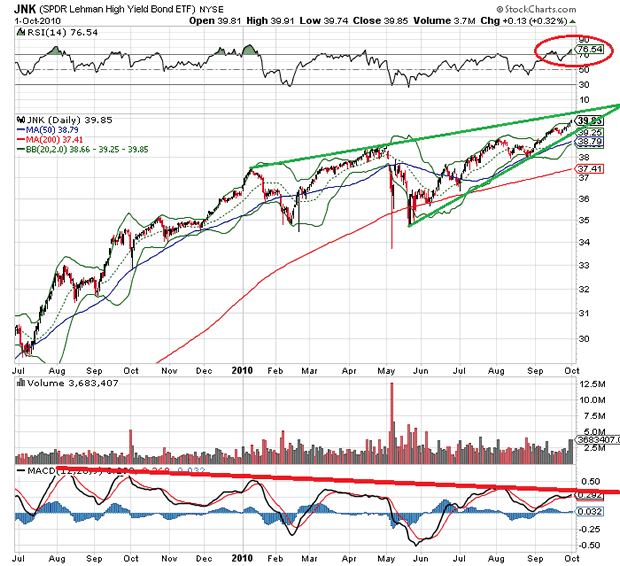
JNK: The junk bond market continues higher as investors stretch for yield. Higher junk bonds is a vote of confidence in the market, and it's moving higher is a bullish indicator. It's very overbought and a break below the uptrend line is the first bearish clue.
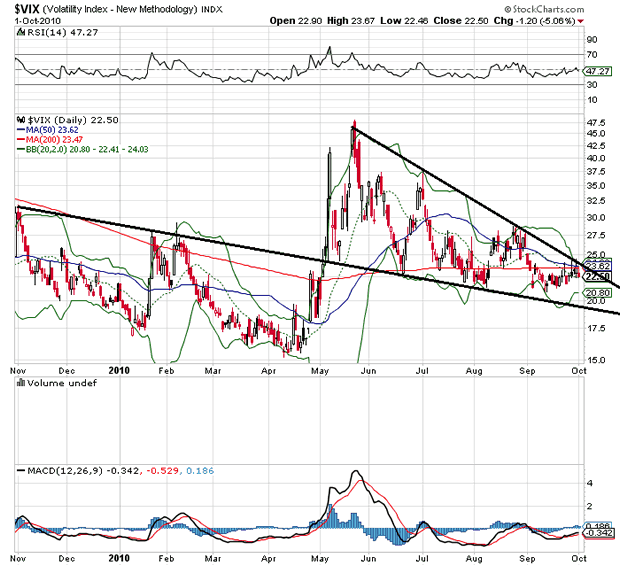
$VIX: It rolled over on Friday after testing the downtrend line. A break out is coming but direction is unknown at this time.
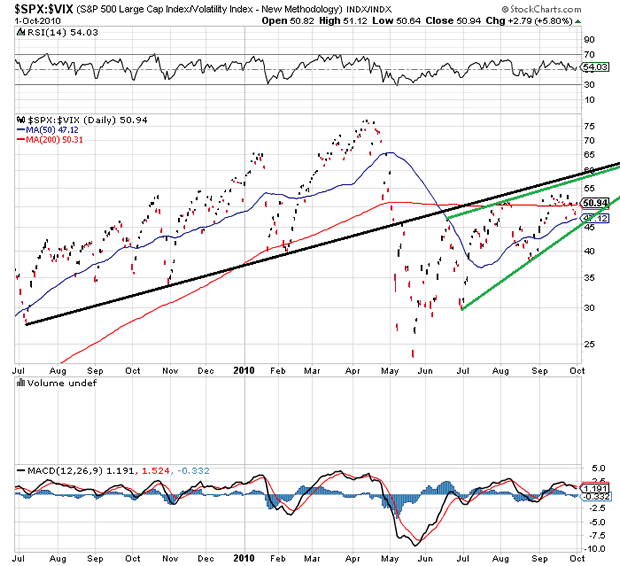
The Risk Chart: The chart continues to trade inside a wedge type pattern with no clues yet.
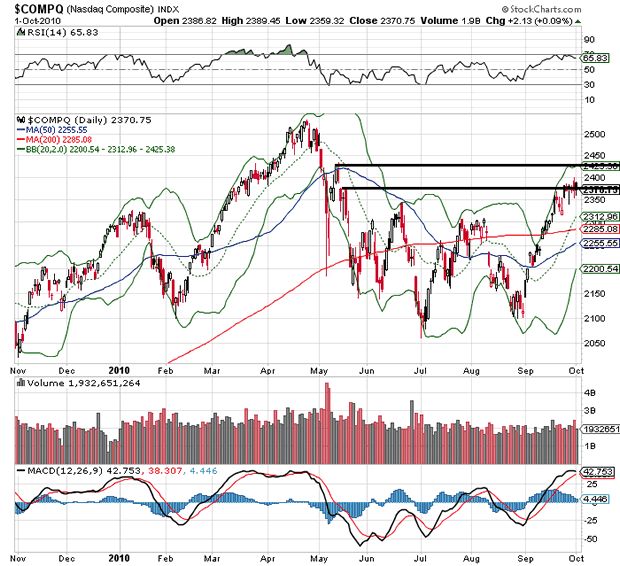
$COMPQ: Stalling so far at resistance. There's enough room on the MACD to get up to the next price resistance.
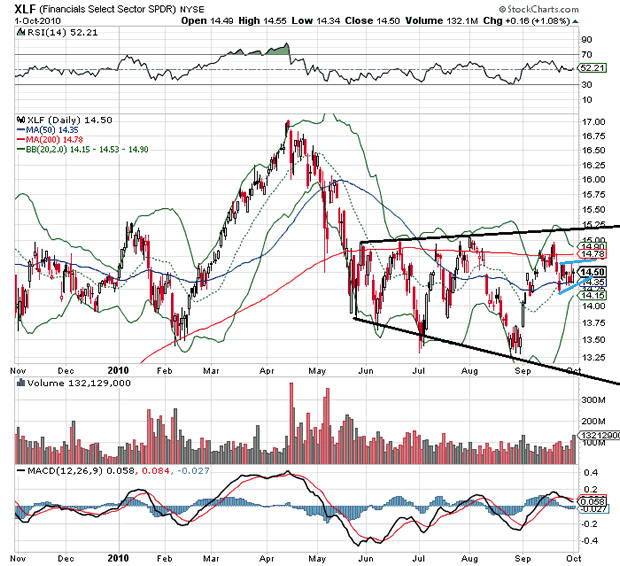
XLF: Still one of the more bearish charts and without the financials I doubt the market is going anywhere in the long run. We have a little consolidation in between the 50 and 200 day MAs. Looks like a bearish flag pattern following a 3 black crows move lower. We should know very soon.
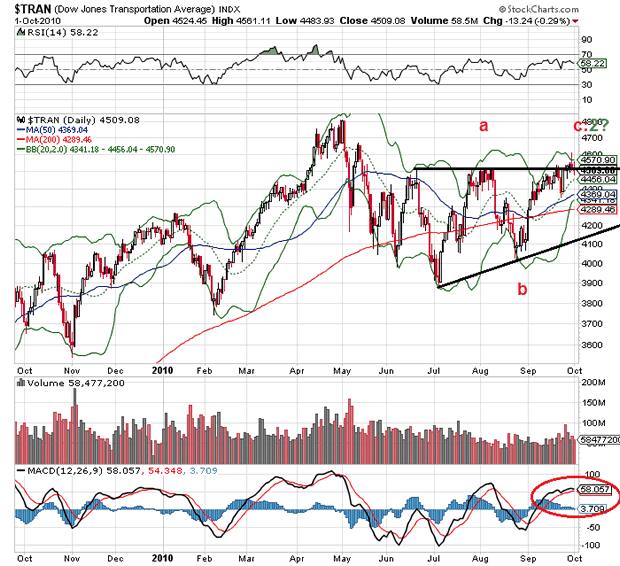
$TRAN: The transports are failing to clear significant resistance. If it rolls over, that's bearish for the market.
Big Tech (AAPL, AMZN, BIDU, GOOG, NFLX, PCLN): Go to: http://roseysoutlook.blogspot.com/
My Watch List: For current trading ideas go to: http://roseysoutlook.blogspot.com/
Hope all is well.
By J.D. Rosendahl
www.roseysoutlook.blogspot.com
J.D. Rosendahl was a former stock broker/investment consultant (currently not licensed) before becoming a Commercial Banker for the past 14 years. He manages his family's wealth, helping them avoid the high tech bubble and the real estate bubble melt downs and preserving wealth.
© 2010 Copyright J.D. Rosendahl - All Rights Reserved
Disclaimer: The above is a matter of opinion provided for general information purposes only and is not intended as investment advice. Information and analysis above are derived from sources and utilising methods believed to be reliable, but we cannot accept responsibility for any losses you may incur as a result of this analysis. Individuals should consult with their personal financial advisors.
© 2005-2022 http://www.MarketOracle.co.uk - The Market Oracle is a FREE Daily Financial Markets Analysis & Forecasting online publication.