


S&P 500 Stock Market Trends Forecast for October 2010
Stock-Markets / Stock Markets 2010 Oct 06, 2010 - 10:59 AM GMTBy: Hans_Wagner

 Following the trend in the market is a well known strategy. Has the recent market action given us any clue on the current trend and if it is about to change?
The break through resistance that has lasted since Spring 2010 is not overwhelming. The market needs to at least pause before resuming its upward trend. On the other hand, this could be an overbought situation where we will see a pull back. I am leaning more toward a pull back. Time will tell.
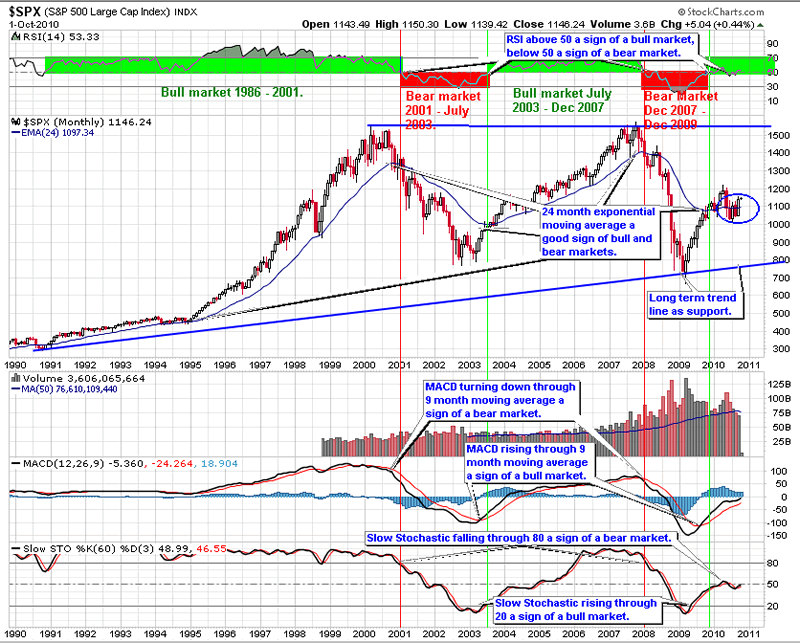
Starting with the indexes gives an overall perspective to the markets. This is monthly chart for the S&P 500 showing 20 years of performance. Since this index is the one used by professional traders it is important to understand how it is performing. This chart is also excellent at defining the longer term trends for the market.
The bull market of the last five years broke down when the S&P 500 turned down through the 24 month exponential moving average. The bear market began when the index fell through the 24-month exponential moving average. Also, the RSI tested the 50 level, another important indicator of bear markets (if the RSI remains below 50 then we are in a bear market) and turned back down. The MACD crossing down through zero is another sign of the transition from bear market to bull market. Finally, the Slow Stochastic fell through 80 as another sign of the beginning of the bear market.
The 24-month EMA has held as support indicating the market will continue to trend upward. Should the 24-month EMA fail on a pullback it might be time to reconsider. For now assume the trend is up.
The RSI is at the 50 level a sign of indecision. The MACD is trying to rise through the zero level. Monitor how it handles the zero level to get an idea of the strength of this move. If the MACD turns down through its 9-month moving average, it will be a sell sign. The Slow Stochastic turned down at the 50 level, indicating another bear market is beginning, though it is turning back up. Monitor how it handles the 50 level.
From a monthly chart perspective, the rally is wavering. However, it looks like the trend is sideways.
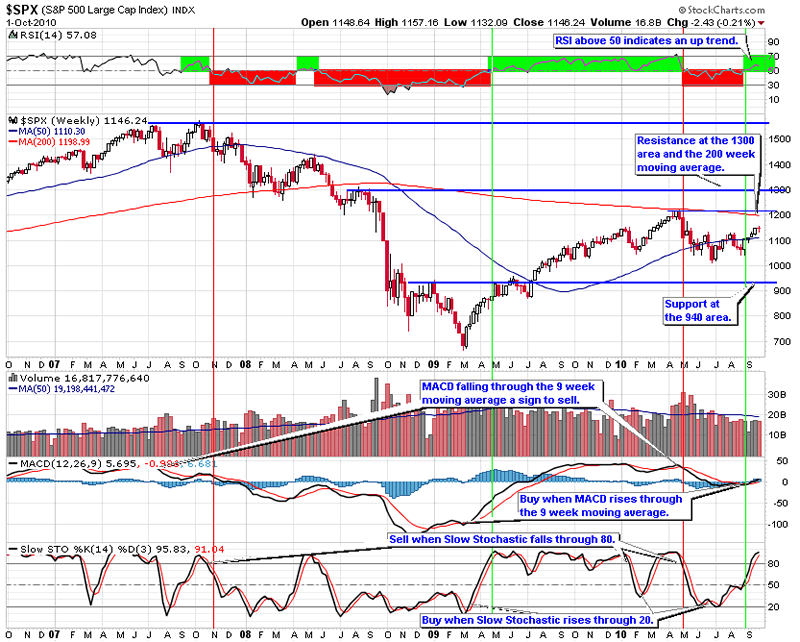
The four-year weekly S&P 500 trend chart shows the formation of horizontal channel with resistance at the 200-week moving average and the 1,300. There is support at the 940 area. This is typical of a stock market that is facing a slow growth economy.
RSI is above 50 a sign of an uptrend. The MACD is turning up through its 9-week moving average giving a buy sign. The Slow Stochastic rebounded at the 20 area. It is now above 80 where it will turn down giving a sell sign.
The trend on the weekly S&P 500 remains sideways between defined support and resistance.
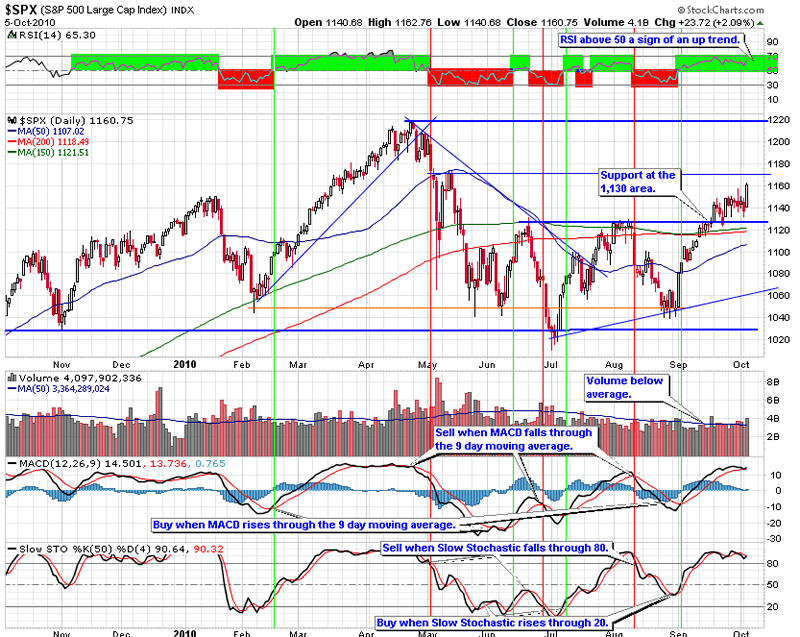
The retest of the 1,130 area held though the rally today was a good sign. We might be seeing the formation of a minor resistance level at the 1,170 area. Volume remains at average. The indicators are at high points where they are more likely to move down giving a sell signal.
The RSI is above 50, a buy sign. The MACD is at a high point where it will turn down through its 9-day moving average giving a sell sign. The Slow Stochastic has reached 80 after rebounding before reaching the 20 level. At some point the Slow Stochastic will fall through 80 giving a sell sign.
The slope of the 150-day moving average is now slightly positive, indicating the S&P 500 is in an up trend.
While volume is at or below average, the market can continue to rise. Therefore, I am looking carefully for opportunities to add a few long positions for trades up to the next target. However, I prefer to wait for a dip in the price.
Given this analysis of the S&P 500 trend line charts, it is important to position your portfolio for a market that is more likely to trend in a range with cyclical rallies and pull backs.
Selecting the right sectors and stock picking will become more important to your success. Look to buy on dips in the market to important support levels. Then add down side protection at interim high points using trailing stops and protective put options to help improve the overall return.
The charts of the S&P 500 trend lines provide a good way for investors to align their portfolios with the overall market trends. Picking the right sectors and stocks will become even more important. Look to buy on dips in the price of the S&P 500 trend charts on the next pull back.
Be sure to use proper capital management techniques including trailing stops, protective put, covered call options and position sizing. When the pullback ends, look to add to long positions with stocks and ETFs from the sectors that are likely to outperform the overall market. Keep in mind, Warren Buffett's first rule of investing is to not lose money. Be patient waiting for good entry points.
By Hans Wagner
tradingonlinemarkets.com
My Name is Hans Wagner and as a long time investor, I was fortunate to retire at 55. I believe you can employ simple investment principles to find and evaluate companies before committing one's hard earned money. Recently, after my children and their friends graduated from college, I found my self helping them to learn about the stock market and investing in stocks. As a result I created a website that provides a growing set of information on many investing topics along with sample portfolios that consistently beat the market at http://www.tradingonlinemarkets.com/
Copyright © 2010 Hans Wagner
If you wish to learn more on evaluating the market cycles, I suggest you read:
Ahead of the Curve: A Commonsense Guide to Forecasting Business and Market Cycles by Joe Ellis is an excellent book on how to predict macro moves of the market.
Unexpected Returns: Understanding Secular Stock Market Cycles by Ed Easterling. One of the best, easy-to-read, study of stock market cycles of which I know.
The Disciplined Trader: Developing Winning Attitudes by Mark Douglas. Controlling ones attitudes and emotions are crucial if you are to be a successful trader.
© 2005-2022 http://www.MarketOracle.co.uk - The Market Oracle is a FREE Daily Financial Markets Analysis & Forecasting online publication.