


Look at the U.S. Dollar USD Index
Currencies / US Dollar Oct 17, 2010 - 05:25 PM GMTBy: Steven_Vincent

 At this time sentiment on the US Dollar Index is about as bearish as ever and at least equivalent to that at the bottom in December 2009. Expectations for a meltdown to all time lows in the context of rampant devaluation via Quantitative Easing by the Fed are nearly universal. While these expectations may, of course, be met in the market, it's worth asking what the implications may be if the setup renders a contrarian result.
Many markets--precious metals in particular-- owe recent gains almost exclusively to the anticipation of substantial future monetary and price inflation. There is cause to believe that that assumption may be at least partially disappointed at the November 3rd Federal Reserve meeting. Fed Chairman Ben Bernanke's statement on Friday, October 15th is likely to initiate a wave of doubt about the size and scope of further Fed inflationary efforts:
Given the Committee's objectives, there would appear--all else being equal--to be a case for further action. However, as I indicated earlier, one of the implications of a low-inflation environment is that policy is more likely to be constrained by the fact that nominal interest rates cannot be reduced below zero. Indeed, the Federal Reserve reduced its target for the federal funds rate to a range of 0 to 25 basis points almost two years ago, in December 2008. Further policy accommodation is certainly possible even with the overnight interest rate at zero, but nonconventional policies have costs and limitations that must be taken into account in judging whether and how aggressively they should be used.
For example, a means of providing additional monetary stimulus, if warranted, would be to expand the Federal Reserve's holdings of longer-term securities.5 Empirical evidence suggests that our previous program of securities purchases was successful in bringing down longer-term interest rates and thereby supporting the economic recovery.6 A similar program conducted by the Bank of England also appears to have had benefits.
However, possible costs must be weighed against the potential benefits of nonconventional policies. One disadvantage of asset purchases relative to conventional monetary policy is that we have much less experience in judging the economic effects of this policy instrument, which makes it challenging to determine the appropriate quantity and pace of purchases and to communicate this policy response to the public. These factors have dictated that the FOMC proceed with some caution in deciding whether to engage in further purchases of longer-term securities.
http://www.federalreserve.gov/newsevents/speech/bernanke20101015a.htm
From a technical perspective, the USD is showing signs of arriving at the resolution of patterns that have been developing for over 20 years.
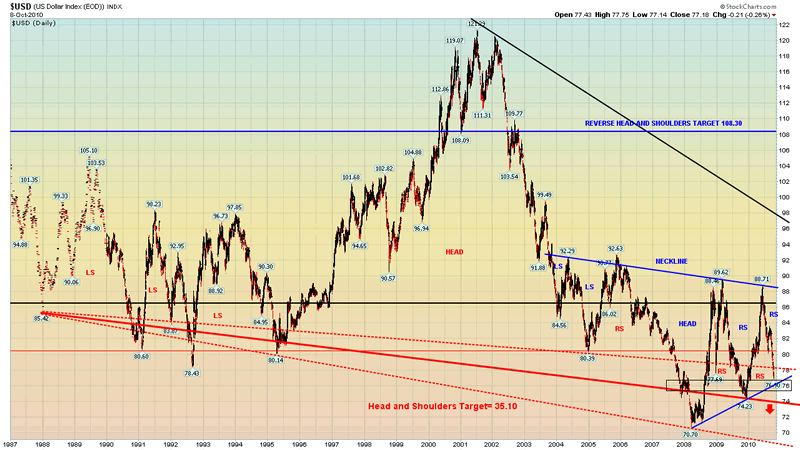
There are arguably two competing patterns on this chart: a head and shoulders top (red) and a reverse head and shoulders (blue).
The larger and more prominent pattern is a 23 year old head and shoulders top pattern. The true neckline of the pattern is indeterminate, but like many of these formations the neckline is really more of a zone than a specific price point. The upper boundary of this zone comes in at the recently violated level of 78 and the lower boundary at the never visited price of 69. I'd take the midpoint around 74 (thick red line) as the key level to watch. It's 23 years in the making and if the pattern completes then the target would be a 50% devaluation of the US Dollar from the neckline break to the 35 level. Such a technical occurence would suggest a highly inflationary or hyperinflationary scenario and the potential loss of confidence in US sovereign debt.
The reverse head and shoulders pattern has been developing for about 7 years now and is generally unacknowledged. Sentiment on the dollar is universally bearish (except among the most hard core of deflationists) and there is a blanket assumption of a major Quantitative Easing program by the Fed at the November 2nd meeting. But what if the Fed does not initiate QE2 and the economy starts to show signs of growth? The second right shoulder could form very quickly with an upside neckline break occurring as the massive short position is covered. Remember that the USD is still the world reserve currencey and demand for the dollar will increase as world trade increases and as the prices for world traded commodities such as crude oil increase. Growth in much of the world is strong and expanding. Demand for US Dollar denominated assests, particularly the stocks of the major Dow and S&P multinationals, would also boost the Dollar Index.
Either way, this market is set up for a significant, important move in the not too distant future.
EURODOLLAR
The primary component of the US Dollar Index is the Euro. After a significant 5 wave decline it appears to be in the final stages of an ABC correction. A move back below the labelled A wave high would confirm the corrective nature of the recent rally and a weekly close above the recent high would have bullish implications.
EUR.USD recently breached the upper rail of a parallel channel. If it continues higher and sustains the breakout then we will need to reinterpret the wave count bullishly. If it fails back then the current bearish count may stand. This would certainly be a major clue as the the direction if the USDX as well as a tip about the direction of many markets which trade in correlation with the Dollar (such as gold).
DOLLAR.YEN
USD.JPY has recently violated the lower rail of a long term pattern.
The apparent abcde bottoming pattern may not yet be void, however, since a downside break of this kind on the e wave is not uncommon before a sharp reversal back into the range. If traders start to sell the Yen again to fund risk trades in commodities and stocks then the prospects for sustained asset price inflation are substantially increased.
AUSTRALIAN DOLLAR
AUD.USD has recently broken a long term downtrend dating back to 1986 and eclipsed its 2008 high. It is currently trading at long term horizontal price resistance.
As the leading "commodity currency", the signal of this price action is that current and future demand for raw materials inputs is strong. This has obvious implications for world economic growth. There's certainly no law that proscribes this component of the Dollar Index from diverging from other components such as the EuroDollar.
Generally these reports as well as twice weekly video reports are prepared for BullBear Trading Service members and then released to the general public on a time delayed basis. To get immediate access just become a member. It's easy and currently free of charge.

Disclosure: No current positions.
By Steve Vincent
Steven Vincent has been studying and trading the markets since 1998 and is a member of the Market Technicians Association. He is proprietor of BullBear Trading which provides market analysis, timing and guidance to subscribers. He focuses intermediate to long term swing trading. When he is not charting and analyzing the markets he teaches yoga and meditation in Los Angeles.
© 2010 Copyright Steven Vincent - All Rights Reserved Disclaimer: The above is a matter of opinion provided for general information purposes only and is not intended as investment advice. Information and analysis above are derived from sources and utilising methods believed to be reliable, but we cannot accept responsibility for any losses you may incur as a result of this analysis. Individuals should consult with their personal financial advisors.
© 2005-2022 http://www.MarketOracle.co.uk - The Market Oracle is a FREE Daily Financial Markets Analysis & Forecasting online publication.