Is a Stock Market Crash Imminent
Stock-Markets / Stock Markets 2010 Oct 20, 2010 - 11:04 AM GMTBy: Bob_Clark

 Assets are already inflated
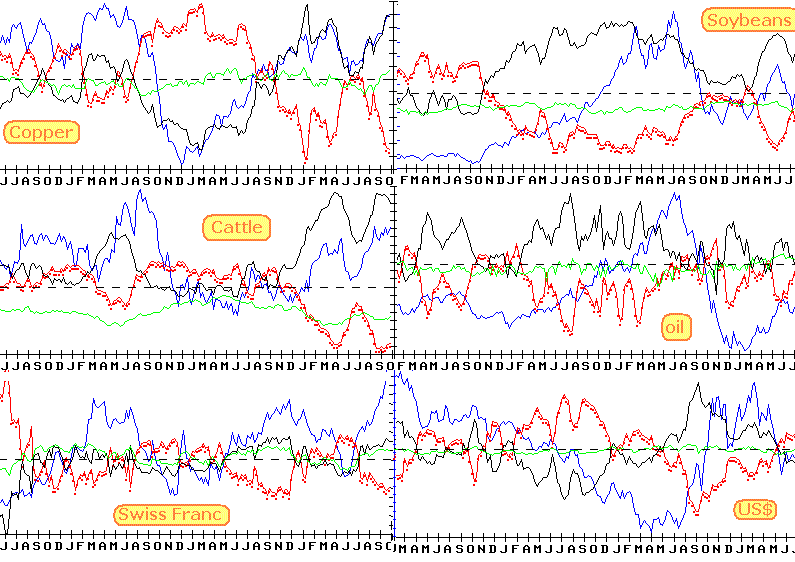
We are seeing some amazing imbalances in the markets. I don't remember so many different asset classes being this heavily shorted or hedged by large commercials, all at the same time. Don't get me wrong, to rise and fall together is fairly normal now. It is the extremes we are reaching that is amazing. The red line on the chart shows commercial long positions minus short positions in the various futures instruments.
The more net short they get, the lower the red line goes. Notice how the price (which is the blue line), usually turns down when the red line gets too far down. These are not the only heavily shorted commodities. The bottom righthand chart is the US dollar which moves counter to everything else. These charts have 5 years of data.
These big traders are registered as commercials by the Commodity Futures Trading Commission because they are in the business, either as growers or users of the underlying commodity. Normally they have a very accurate track record when it comes to forecasting prices.
They seem to be locking in these high prices.

We are seeing warning flags, that seem to be saying that Bernanke's inflation gambit is a bluff. Are they sending us useful signals? Does what the position in corn or beans mean anything to the price of equities? Do the cycles offer any clues of what to expect? Lets see.
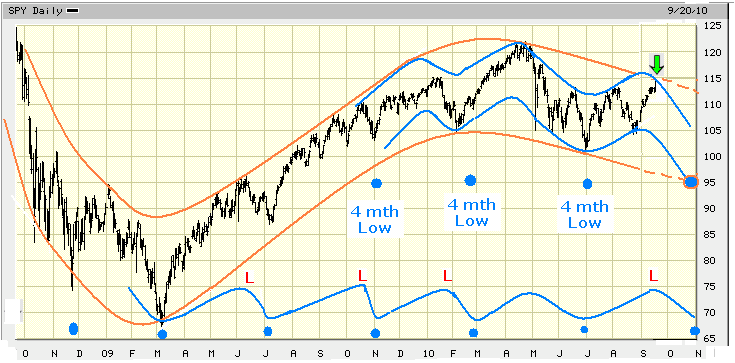
The last time I looked at the stock market I warned that a sizable short squeeze should occur. Please see "Are the stock bears doomed". The subsequent ramp up has done a serious injustice to the bears.
What are the cycles saying now
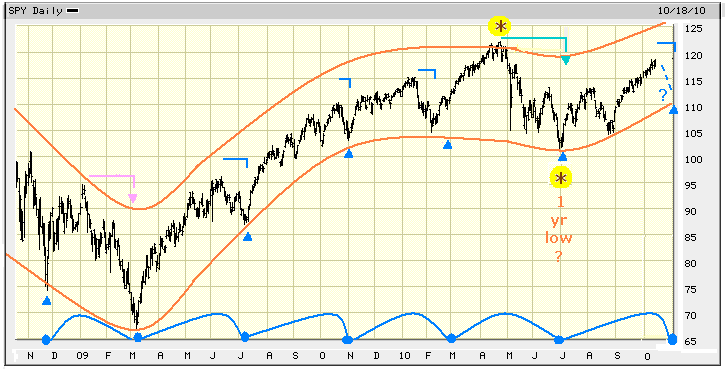
In the chart below you see a chart of the SPY (S&P 500 exchange traded fund). On it I have marked the 4 month cycle that typically dominates the smaller cycles. As you see we are due for a low within the next 2 weeks. You will also notice that unless there is crash, it will be higher than the last 4 month low we made in July. Notice too that we have gone up for 3 and 1/2 months. If you look back on the chart you will see this is typical of bull markets. It is called late translation and it signals that the larger trends or cycles, the ones bigger than the 4 month trading cycle, are going up as well. The result is represented by the orange envelope.
Also notice that the low we made in July was lower than the previous two, 4 month trading cycle lows. That is indicative of a larger cycle influencing the smaller trading cycle. I am making the assumption that it was the 1 year cycle low, which normally bottoms in the fall. It has not been as predictable as the 4 month cycle but several other markets such as the metals bottomed at the same time, so I am attaching some importance to it.

The things we can take from looking at the price motion is:
1) We have gone late translation in this rally and are due for a 4 month trading cycle low soon.
2) Where and when the next 4 month low is made will tell us a lot about the bigger trends (orange channel). A higher low should give the same subsequent bullish results that were seen in mid to late 2009.
3) If I am right about July being a low of longer duration (1 year), then we have seen late translation in that cycle as well. It topped in April and only fell for 2 months. The July low has also come in much higher than the crash low of 2008, that means the sum of all trends longer than 1 year are going up as well. Although I didn't draw it in, you can visualize a larger envelope connecting the lows of 2008 and July 2010 and it is going hard up as well.
There are conflicting signals
Just about every asset is stretched to the upside and the large commercial users of those products are making bets that there will be lower prices ahead.
At the same time, the late translation we see in both the 4 month and the 1 year trading cycles of the stock market hints at a strong underlying current, which should provide lift into the new year.
The 4 month low is not in yet and we can still break hard to the downside in the next 2 weeks. Also there is always the chance that we go from late translation in this 4 month cycle to early translation in the next. Although it is rare, it is not impossible and I will be watching for it.
The imbalance we are seeing in all assets except real estate are waving a yellow flag, so we need to stay vigilant.
Bottom line
Is a stock market crash imminent? The next couple of weeks leading up to the Fed meeting and the election will be very telling.
If we get past the coming 4 month trading cycle low without a large dislocation to the downside, then as it currently presents itself, the cyclical model says the stock market looks like it will continue to be strong into next year.
Struggling?
Confused about the markets? Sitting in cash may be the worst thing you can do. I train people to manage money. I work mainly with fund managers and floor traders but the training I offer is also very valuable to every small independent investor. I have created a set of affordable videos designed to take your trading skills to a professional level. The feed back has been great so far. Please go to my blog for more information.
The markets are controlled by big players, learn to follow the money.
Bob Clark is a professional trader with over twenty years experience, he also provides real time online trading instruction, publishes a daily email trading advisory and maintains a web blog at www.winningtradingtactics.blogspot.com his email is linesbot@gmail.com.
© 2010 Copyright Bob Clark - All Rights Reserved
Disclaimer: The above is a matter of opinion provided for general information purposes only and is not intended as investment advice. Information and analysis above are derived from sources and utilising methods believed to be reliable, but we cannot accept responsibility for any losses you may incur as a result of this analysis. Individuals should consult with their personal financial advisors.
© 2005-2022 http://www.MarketOracle.co.uk - The Market Oracle is a FREE Daily Financial Markets Analysis & Forecasting online publication.
Comments
|
Tim
21 Oct 10, 03:10 |
"The last time I looked at the stock market"
You appear to have forgotten about your September article http://www.marketoracle.co.uk/Article22914.html
|


