Crude Oil Topping Pattern
Commodities / Crude Oil Oct 22, 2010 - 03:45 AM GMTBy: Mike_Paulenoff
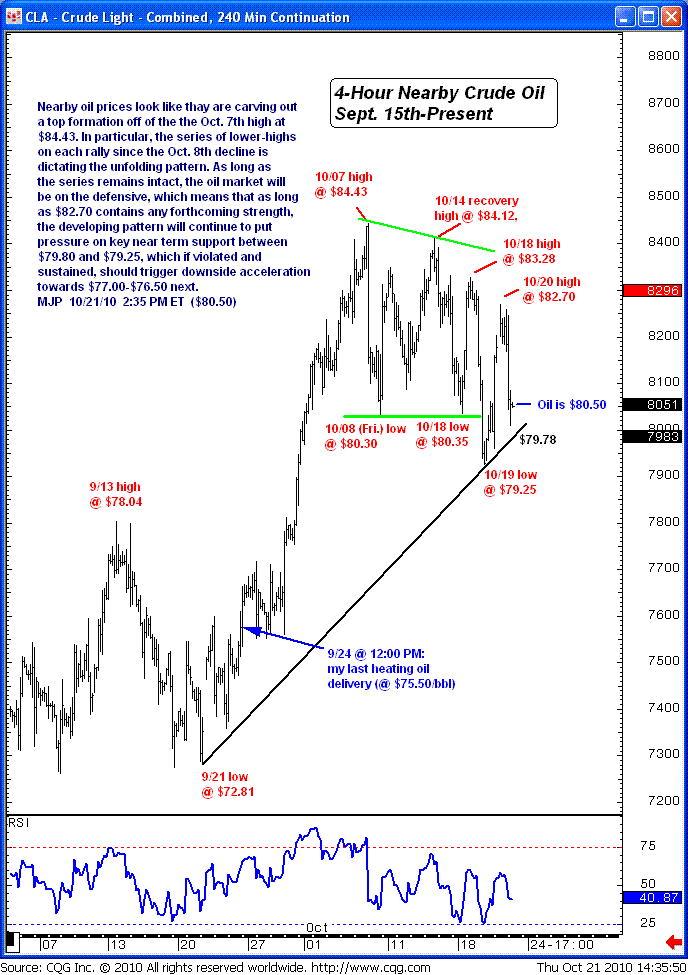
Nearby oil prices look like they are carving out a top formation off of the October 7 high at $84.43. In particular, the series of lower highs on each rally since the October 8 decline is dictating the unfolding pattern.
As long as the series remains intact, the oil market will be on the defensive. That means that as long as $82.70 contains any forthcoming strength, the developing pattern will continue to put pressure on key near-term support between $79.80 and $79.25, which if violated and sustained should trigger downside acceleration towards $77.00-$76.50 next.
ETF traders may want to watch for downside in the US Oil Fund (NYSE: USO).

Sign up for a free 15-day trial to Mike's ETF & Stock Trading Diary today.
By Mike Paulenoff
Mike Paulenoff is author of MPTrader.com (www.mptrader.com), a real-time diary of his technical analysis and trading alerts on ETFs covering metals, energy, equity indices, currencies, Treasuries, and specific industries and international regions.
© 2002-2010 MPTrader.com, an AdviceTrade publication. All rights reserved. Any publication, distribution, retransmission or reproduction of information or data contained on this Web site without written consent from MPTrader is prohibited. See our disclaimer.
Mike Paulenoff Archive |
© 2005-2022 http://www.MarketOracle.co.uk - The Market Oracle is a FREE Daily Financial Markets Analysis & Forecasting online publication.


