


Gold Price Drop Nothing Unusual After a Long Bull Run
Commodities / Gold and Silver 2010 Oct 24, 2010 - 10:32 AM GMTBy: Merv_Burak

 It was a bummer of a week but progressed as expected. So far the decline in gold price is nothing unusual and after a long upward climb, to be expected. How far down? That’s a good question. Good support around the $1250 mark but it might not even go that far. Stay tuned.
GOLD : LONG TERM
Despite the weekly drop in the price of gold nothing much has changed from the long term indicators and ratings point of view. Gold remains above its positive sloping moving average line and might even remain so should the price drop to that $1250 support level. The long term momentum indicator has now dropped below its trigger line and the trigger has turned downward but the indicator still remains comfortably in its positive zone. The volume indicator continues to move ever higher into new high territory and remains above its positive sloping trigger line. So, no change in the long term rating even though there is some weakness showing up. The rating remains BULLISH.
INTERMEDIATE TERM
The intermediate term is similar to the long term as far as the indicators are concerned, except maybe with a little more progress towards the down side. Gold remains above its positive sloping moving average line. The momentum indicator is well entrenched moving lower and is below its negative sloping trigger line but still remains in its positive zone. The volume indicator also remains positive being above its positive sloping trigger line. The gold price has just touched its up trend line from the July low while the momentum indicator has now broken below its up trend line for the same period. From the intermediate term point of view the price of gold is losing greater strength than the price itself might indicate. For now, however, the intermediate term rating remains BULLISH with the short term moving average line confirming the bull by remaining above the intermediate term line.
SHORT TERM
On the short term things are not quite so rosy. As often mentioned, one would expect trend reversals to start in the short term indicators and here they are. Gold has broken below its short term moving average line and the line has now turned to the down side. The momentum indicator has been weakening for a couple of weeks now and dropped into its negative zone on Thursday, where it remained on Friday. It also remains below its negative sloping trigger line. As for the daily volume action, it has been acting as one would expect it to act during a decline. The daily volume seems to lose strength on down days and gain a little strength on up days but nothing too dramatic. The short term rating must now be classified as BEARISH. The very short term moving average line is still above the short term line and has not yet confirmed this bear.
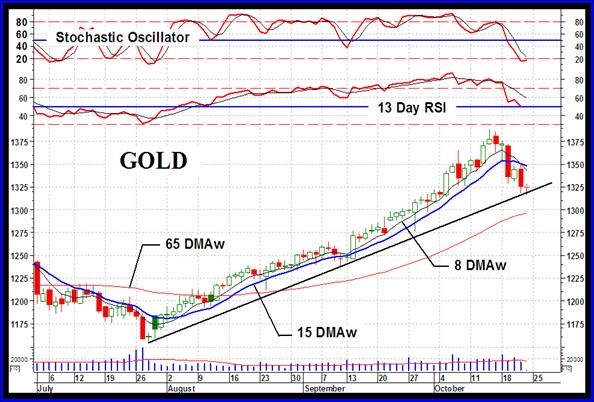
As for the immediate direction of least resistance, one is very tempted to go with the down side but gold may be bouncing off that up trend line and we might have a day or two of lateral action. The Stochastic Oscillator is already in its oversold zone suggesting that some rebound may be ahead. I’ll go with the lateral direction for the next day or two.
SILVER
For the past month and a half silver has been in a steady climb with only very minor reactions along the way. The price closed above its very short term moving average line every day (except for one day), which is very unusual. Well, this week silver reacted more than in the recent past and has dropped below that very short term moving average line. The line has also turned to the down side. In fact the price has dropped below the normal short term moving average line and that line has turned downward. With the short term momentum also sliding lower the short term rating has now reversed to a BEARISH rating, although the very short term moving average line has not confirmed that bear as it has not yet dropped below the short term moving average line for confirmation.
At this time the reaction of the past week has not affected the intermediate and long term indicators so both time period ratings remain as they were for weeks, BULLISH.
PRECIOUS METAL STOCKS
Well, finally we had a week that was nothing to write home about. The gold and silver stocks were in a basic declining mode although there were still 37 stocks (23%) in the universe of 160 that closed the week on the up side. However, if we go over to the quality sector we see a different story, only one stock out of the 30 was on the up side. So, the decline this past week was mostly due to the larger, higher quality stocks. This is born out by the sector Indices where the Qual-Gold Index declined by 3.8% while the Gamb-Gold Index declined by only 1.9%. Even the Penny Arcade Index only declined by 2.5%. With penny stocks if we were in a real decline they would have declined far more, percentage wise. It only takes a 2 cent drop for a 20 cent stock to show a 10% decline so the pennies held up pretty well. As long as the pennies are still holding on then we can breathe easier that the market is not in a serious decline, only a normal reaction to a long rally.
The speculative silver stocks, which had been in the lead during the recent rally, took the biggest hit this past week with the Spec-Silver Index declining by 4.2%. This was primarily due to 3 of the 25 stocks showing declines in the double digit, % wise.
The Spec-Silver Index had the steepest decline of the Merv’s Indices. The major North American Indices, however, showed declines just slightly more than that, primarily due to their method of calculating their Indices. As often mentioned, the Merv’s Indices are based upon the AVERAGE weekly performance of all of the component stocks.
Merv’s Precious Metals Indices Table
Well, that’s it for this week. Comments are always welcome and should be addressed to mervburak@gmail.com.
By Merv Burak, CMT
Hudson Aero/Systems Inc.
Technical Information Group
for Merv's Precious Metals Central
For DAILY Uranium stock commentary and WEEKLY Uranium market update check out my new Technically Uranium with Merv blog at http://techuranium.blogspot.com .
During the day Merv practices his engineering profession as a Consulting Aerospace Engineer. Once the sun goes down and night descends upon the earth Merv dons his other hat as a Chartered Market Technician ( CMT ) and tries to decipher what's going on in the securities markets. As an underground surveyor in the gold mines of Canada 's Northwest Territories in his youth, Merv has a soft spot for the gold industry and has developed several Gold Indices reflecting different aspects of the industry. As a basically lazy individual Merv's driving focus is to KEEP IT SIMPLE .
To find out more about Merv's various Gold Indices and component stocks, please visit http://preciousmetalscentral.com . There you will find samples of the Indices and their component stocks plus other publications of interest to gold investors.
Before you invest, Always check your market timing with a Qualified Professional Market Technician
Merv Burak Archive |
© 2005-2022 http://www.MarketOracle.co.uk - The Market Oracle is a FREE Daily Financial Markets Analysis & Forecasting online publication.