Fuzzy Silver, What's Next for SLV ETF?
Commodities / Gold and Silver 2010 Oct 28, 2010 - 04:41 AM GMTBy: Bob_Clark

 Sometimes the picture is not clear. This type of trading environment is what separates the men from the boys.
Risk management is not well understood, but it is vital to successful investing and trading.
The precious metals markets are correcting as expected. Commodities in general and the metals in particular have seen a "love in" that would make Woodstock blush. So now what?
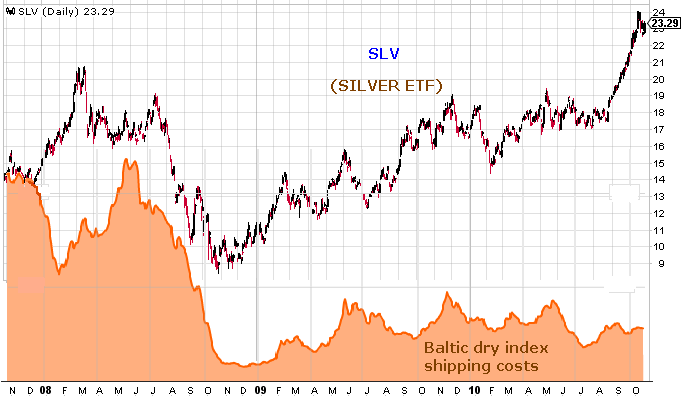
In the following chart I have overlaid the Baltic dry index which shows what it costs to ship non liquid commodities. Notice that this is the first time that it has not confirmed the up moves in the price of silver. Does it mean anything? It seems to be saying that currently many of the world's commodities are not been used, consumed or shipped and that suggests that they are being hoarded. Hoarding usually doesn't end well for the speculator. Does this have implications for the metals? Is this chart screaming sell silver and gold?
We have to consider that when we made previous highs in the Baltic index there were not as many ships available to lease. They have been building ships as fast as they were building condos in Florida during the housing bubble. We will not see those rates again for a long time, but the lack of any kind of move in the index is a caution flag. Another thing that it could point to is a crummy Christmas sales season.
All that can change however, as it did last year around this time. Notice we had the same dynamic but the index did ultimately confirm the move in silver, so we will watch it carefully for strength during November.

Let's take a look at the silver chart itself and see if the cycles can help us look into the future.
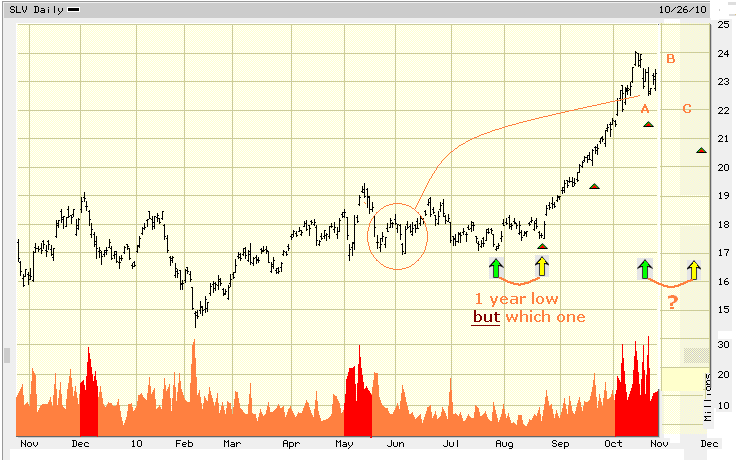
The low we made in the July-August time frame was most likely a 1 year cycle low. That is when we often see the metals make a seasonal bottom for the year. There is a problem however, because we compressed into August there is not a clearly defined point that we can definitively call the low. Compressions are not unusual but they make for fuzzy entry points later. Like now.
Before we look at the cyclical dynamic, I want to correlate the two charts. We have seen a lot of volume in these highs after a very strong move to relatively high prices. We have seen the same thing in most commodities and these high prices have been met by the big commercial producers and users with lots of selling. In the past when we have seen high volume situations like this, once the market has run out of steam we have moved sideways for a time. I highlighted one such area on the chart and if you look at longer term chart you will see more examples. I am not saying that is what is going to happen but it quite possible. I think at the very least we can say that things got a little frothy and there is the risk of disappointment next week.
Cyclically there is no easy answer either.
The metals tend to have a 3 month trading cycle. Plus a 1 month cycle that is also identifiable. We have just made a 1 month low which I have marked with a red triangle. We may have also made a 3 month trading cycle low.
As the chart shows there are two possible scenarios to consider.
The first is, we go up now.
If we have made a 3 month trading cycle low we should start to trend again and go straight up until the end of November.
The second is, we churn in a range for another few weeks and quite possibly go lower in November. The end result should still be higher prices near year end, the trading cycle low will come in and it will be higher than the last one and we will rally from it. It is what happens in between now and when the trading low is made that becomes a matter of risk management.
That is especially true if you are adding, or entering a new position for the first time. We want to be in, but we also want to be in low.

To sum up
We will either make the trading cycle low now, if that is the case, we will bolt straight up for a month and hit 26.00.
However, if we are starting an ABC type of correction, we will be choppy maybe for a full month and then bolt up to 26.00 but it will make managing risk much more difficult. The high volume and the over extended nature of the other markets, points to a more complicated correction and lots of confusion. Remember the Fat Boys love to muddy the waters.
I am using a simple strategy that lets me enter at high, over bought levels and participate in the next run up if it comes now. It also keeps me from getting killed if it turns into a choppy mess.
I enter at a low point and when we bounce I take profits on half the position and place a stop loss order on the remaining half position near or at break even. I then have a risk free trade that should actually yield a profit.
I have posted a link to my E-visory on my blog, to show how I just did it in slv, in real time.
Everyone wants to profit from the runs like we just had. The thing is, they are rare, 80% of the time markets go nowhere. As investors and traders we need the skills to trade those less directional times.
Bob Clark is a professional trader with over twenty years experience, he also provides real time online trading instruction, publishes a daily email trading advisory and maintains a web blog at www.winningtradingtactics.blogspot.com his email is linesbot@gmail.com.
© 2010 Copyright Bob Clark - All Rights Reserved
Disclaimer: The above is a matter of opinion provided for general information purposes only and is not intended as investment advice. Information and analysis above are derived from sources and utilising methods believed to be reliable, but we cannot accept responsibility for any losses you may incur as a result of this analysis. Individuals should consult with their personal financial advisors.
© 2005-2022 http://www.MarketOracle.co.uk - The Market Oracle is a FREE Daily Financial Markets Analysis & Forecasting online publication.


