U.S. Dollar Chart Suggests Caution for Gold Bulls
Commodities / Gold and Silver 2010 Oct 28, 2010 - 12:33 PM GMTBy: Mike_Paulenoff
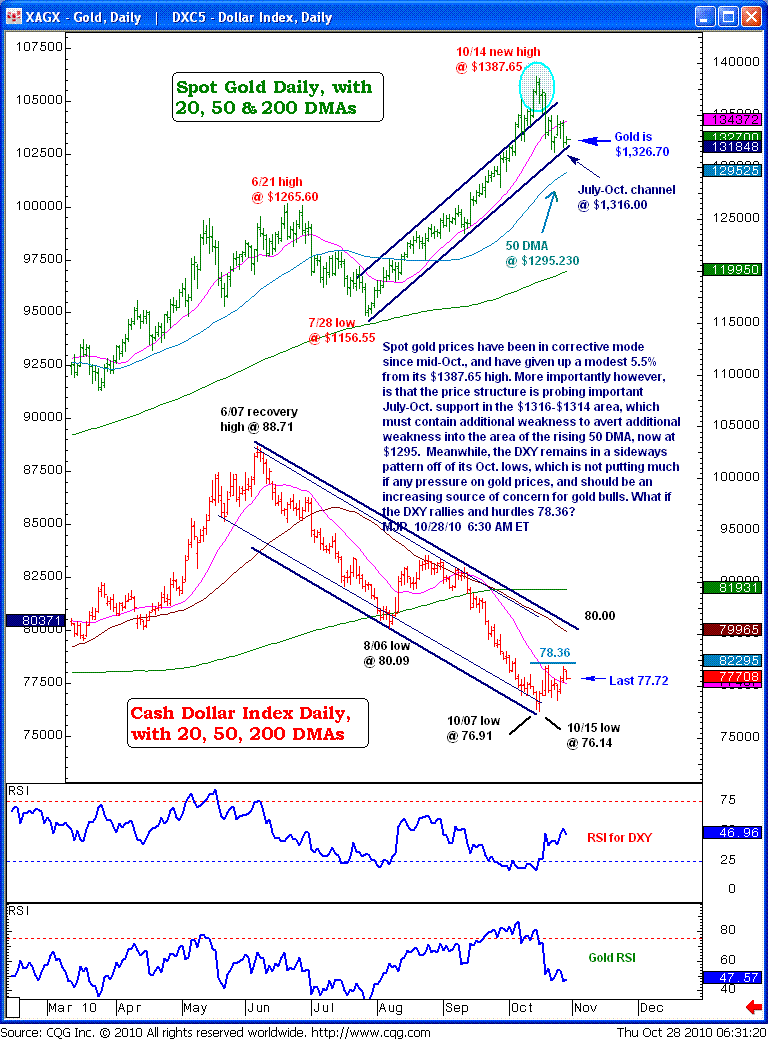
Spot gold prices have been in a corrective mode since mid-October and have given up a modest 5.5% from the $1387.65 high. More importantly, however, is that the price structure is probing important July-Oct support in the $1316-$1314 area, which must be contained to avert additional weakness into the area of the rising 50 DMA, now at $1295.
Meanwhile, the cash Dollar Index (DXY), whose down-channel in the comparison chart is inverse to gold's up-channel, remains in a sideways pattern off of its October lows. This is not putting much, if any, pressure on gold prices, although should be an increasing source of concern for gold bulls, including holders of the SPDR Gold Shares (GLD), especially if the DXY (recently at 77.72) rallies and hurdles 78.36.

Sign up for a free 15-day trial to Mike's ETF & Stock Trading Diary today.
By Mike Paulenoff
Mike Paulenoff is author of MPTrader.com (www.mptrader.com), a real-time diary of his technical analysis and trading alerts on ETFs covering metals, energy, equity indices, currencies, Treasuries, and specific industries and international regions.
© 2002-2010 MPTrader.com, an AdviceTrade publication. All rights reserved. Any publication, distribution, retransmission or reproduction of information or data contained on this Web site without written consent from MPTrader is prohibited. See our disclaimer.
Mike Paulenoff Archive |
© 2005-2022 http://www.MarketOracle.co.uk - The Market Oracle is a FREE Daily Financial Markets Analysis & Forecasting online publication.


