Most Popular
1. Banking Crisis is Stocks Bull Market Buying Opportunity - Nadeem_Walayat
2.The Crypto Signal for the Precious Metals Market - P_Radomski_CFA
3. One Possible Outcome to a New World Order - Raymond_Matison
4.Nvidia Blow Off Top - Flying High like the Phoenix too Close to the Sun - Nadeem_Walayat
5. Apple AAPL Stock Trend and Earnings Analysis - Nadeem_Walayat
6.AI, Stocks, and Gold Stocks – Connected After All - P_Radomski_CFA
7.Stock Market CHEAT SHEET - - Nadeem_Walayat
8.US Debt Ceiling Crisis Smoke and Mirrors Circus - Nadeem_Walayat
9.Silver Price May Explode - Avi_Gilburt
10.More US Banks Could Collapse -- A Lot More- EWI
Last 7 days
Stock Market Volatility (VIX) - 25th Mar 24
Stock Market Investor Sentiment - 25th Mar 24
The Federal Reserve Didn't Do Anything But It Had Plenty to Say - 25th Mar 24
Stock Market Breadth - 24th Mar 24
Stock Market Margin Debt Indicator - 24th Mar 24
It’s Easy to Scream Stocks Bubble! - 24th Mar 24
Stocks: What to Make of All This Insider Selling- 24th Mar 24
Money Supply Continues To Fall, Economy Worsens – Investors Don’t Care - 24th Mar 24
Get an Edge in the Crypto Market with Order Flow - 24th Mar 24
US Presidential Election Cycle and Recessions - 18th Mar 24
US Recession Already Happened in 2022! - 18th Mar 24
AI can now remember everything you say - 18th Mar 24
Bitcoin Crypto Mania 2024 - MicroStrategy MSTR Blow off Top! - 14th Mar 24
Bitcoin Gravy Train Trend Forecast 2024 - 11th Mar 24
Gold and the Long-Term Inflation Cycle - 11th Mar 24
Fed’s Next Intertest Rate Move might not align with popular consensus - 11th Mar 24
Two Reasons The Fed Manipulates Interest Rates - 11th Mar 24
US Dollar Trend 2024 - 9th Mar 2024
The Bond Trade and Interest Rates - 9th Mar 2024
Investors Don’t Believe the Gold Rally, Still Prefer General Stocks - 9th Mar 2024
Paper Gold Vs. Real Gold: It's Important to Know the Difference - 9th Mar 2024
Stocks: What This "Record Extreme" Indicator May Be Signaling - 9th Mar 2024
My 3 Favorite Trade Setups - Elliott Wave Course - 9th Mar 2024
Bitcoin Crypto Bubble Mania! - 4th Mar 2024
US Interest Rates - When WIll the Fed Pivot - 1st Mar 2024
S&P Stock Market Real Earnings Yield - 29th Feb 2024
US Unemployment is a Fake Statistic - 29th Feb 2024
U.S. financial market’s “Weimar phase” impact to your fiat and digital assets - 29th Feb 2024
What a Breakdown in Silver Mining Stocks! What an Opportunity! - 29th Feb 2024
Why AI will Soon become SA - Synthetic Intelligence - The Machine Learning Megatrend - 29th Feb 2024
Keep Calm and Carry on Buying Quantum AI Tech Stocks - 19th Feb 24

Market Oracle FREE Newsletter

How to Protect your Wealth by Investing in AI Tech Stocks

A Fingerprint of Instability in Biology and Finance, Time Series and Fractals Analysis

InvestorEducation / Financial Markets Oct 28, 2010 - 12:48 PM GMT

By: Ashvin_Pandurangi

InvestorEducation

Best Financial Markets Analysis ArticleRecently, there has been much research into the chaotic dynamics of complex systems in many different fields. Complexity theory provides great analytical insights into the structures of "hard" sciences such as biology and also social sciences such as economics. It can even reveal dyamic properties that will serve as predictive indicators across both of the two fields (and perhaps many others). It should be noted that "predictive" doesn't necessarily mean a specific result will always follow, but that it becomes significantly more likely to occur. The following article will explore a relatively simple indicator which identifies high probabilities of instability in both the human circulatory system (specifically cardiac) and financial markets. Let's start this discussion with a short quiz. Take a look at the following four graphs of heartbeats per minute over a 30-minute interval, and see if you can guess which one(s) belongs to a healthy patient and which one belongs to a patient facing sudden cardiac death:


Link

Many people would presume the first graph belonged to a patient with severe heart problems, but they would be incorrect. In fact, the first one is that of a healthy person at sea level, the second of a healthy person at high altitude, the third of a person with obstructive sleep apnia and the fourth of a person with ventricular fibrillation. [1]. The key observation here is that the variability of time intervals between heartbeats decreases as the subject's cardiac and respiratory functions become more unstable. Variability is not the same as randomness, however, and is actually the product of an underlying complex mathematical structure. We can describe it as "deterministic chaos", where the initial conditions of the sympathetic and parasympathetic nervous systems (influenced by thermo-regulation, hormones, sleep-wake cycles, meals, stress, etc.) [2] give rise to beat time intervals that are locally unpredictable, but exhibit a globally identifiable pattern. It is the intricate "music" that results from a complex orchestra of underlying instruments and notes, rather than the "noise" which would result from random tones. [3].

The time series of a healthy human heartbeat is a fractal structure, since it is an irregular pattern with fractional dimensions that exhibits "self-similarity" at different scales of resolution. We observe fractal structures in many different natural systems, whether it be a continental coast line, branching tree, human circulatory system or even impulses generated from biological processes. The fractal structures that arise from processes of the heart dynamically interact with all other rhythms of the body and help maintain a stable lifeform. Although these rhythms each exhibit a deterministic variability of their own, they also synchronize with each other so that different parts of the body can work together while staying within a bounded range of operation. An unhealthy human heart, on the other hand, is characterized by a collapse of inter-communication with other signals and a return to a regular, intrinsic rhythm that has lost its emergent order. [4].

   
Fractal Coastline
  

Fractal Blood Vessels


Fractal Tree

     It is important to understand that complex dynamics leading to emergent order may also endogenously lead to instability and collapse. Human beings with healthy hearts may be able to perform many activities within a given day. Perhaps some of those activities and interactions will lead to significant amounts of stress, which negatively influences the peoples' eating and/or exercise habits. As their circulatory system becomes less efficient, they require more energy to simply maintain the level of activity they have become accustomed to. The people turn to more food and/or other substances to acquire this energy, and eventually they are caught in a destructive cycle which undermines the heart's stability. Of course, this example is just one potential nonlinear path of cardiac evolution, and there are obviously many examples of people maintaining relatively healthy hearts for much of their lives. This endogenous emergence of fragility is much more frequent and evident in complex financial markets where, as Hyman Minsky would say, stability breeds instability. [5].

    Didier Sornette produced an excellent report in 2002 entitled Critical Market Crashes [6], analyzing the endogenous patterns that emerge in stock markets before they reach a "critical point" at which a crash is most likely to occur. Most of the report is extremely technical and hard to digest for the average person who is not very familiar with nonlinear statistical mathematics (which certainly includes me!). However, there are a few qualitative points made that are readily accessible to a lay reader. For example, the report shows that asset markets typically crash when "order wins out over disorder", or when the variability of traders' opinions on the future direction of prices decreases to a certain threshold, causing the market to become extremely illiquid. [7, 37]. This dynamic is also the reason why bullish extremes in market sentiment tend to mark a top that will soon be reversed. However, the order that "wins out" in a market crash is a superficial order, rather than the natural order which emerges from the variable behavior of individual agents. The former can be analogized to the regular time intervals between unhealthy heartbeats, while the latter would be the variable intervals which correspond to biological synchronization and stability.

     Sornette also explains that dynamic stock market patterns are characterized by "discrete scale invariance", which is basically another way of saying they are fractal in nature. A typical chart of stock prices over any time frame will produce highly volatile, yet non-random patterns that are self-similar to patterns on shorter or longer time scales. Related to Sornette's work is the "fractal markets hypothesis", which has been explained simply and coherently by the Australian economist Steve Keen in a slide lecture he produced and made available to the public. [8]. To summarize, this hypothesis suggests that the stock market exhibits deterministic chaos, making the short-term movements of prices extremely difficult, if not impossible, to predict. Similar to the healthy human heartbeat, the market achieves aggregate stability when investors have variable time horizons and expectations for their investments. In contrast, a speculative bubble is formed when many investors share the same expectations, imitating each other's decisions to buy, and a market crash occurs when they all "rush for the exit" at the same time. [Slide 36]

     The reason why variability of time horizons is so important for market stability can be explained with a simple example. Let's compare an average day trader with a five-minute time horizon to an institutional investor (such as a pension fund) with a weekly time horizon from 1992-2002. The average five-minute price change in 1992 was -0.000284% (an overall "bear market"), with a standard deviation of 0.05976 per cent. A six standard deviation drop (-.359%) in price during that time period could easily wipe out the day trader's investment if it continues. The institutional investor, on the other hand, would consider that drop a buying opportunity since weekly returns over the ten-year period averaged 0.22% with a standard deviation of 2.39%. The relatively large drop for the day trader is basically a non-event for the weekly trader's technical/fundamental outlook, so the latter can buy the dip and provide stabilizing liquidity to the market. [Slides 38-39]

     As most people in the world of finance know by now, every week in the stock market is characterized by increasingly few actors trading on an increasingly short time scale. Retail investors with relatively long-term time horizons and variable trading preferences have been exiting the market in droves (~$80B equity outflows from domestic mutual funds YTD) [9], while computer-based high frequency traders have dominated the market and buy/sell to each other in time scales best measured by seconds (one of the largest HFT firms, Tradebot, holds stocks for an average of 11 seconds). [10]. A paper by Reginald Smith, from the Bouchet Frankline Institute of Rochester, has confirmed this trend by showing that high frequency trading (HFT) "is having an increasingly large impact on the microstructure of equity trading dynamics". Currently, more than 70% of U.S. equity trading comes in the the high frequency variety. Smith also states that "traded value, and by extension trading volume, fluctuations are starting to show self-similarity at increasingly shorter timescales". [11]. In essence, the robot traders are dominating the market and destroying the natural fluctuations between stocks traded, shares traded, trading volume and time horizons that characterize a "healthy" market.

 
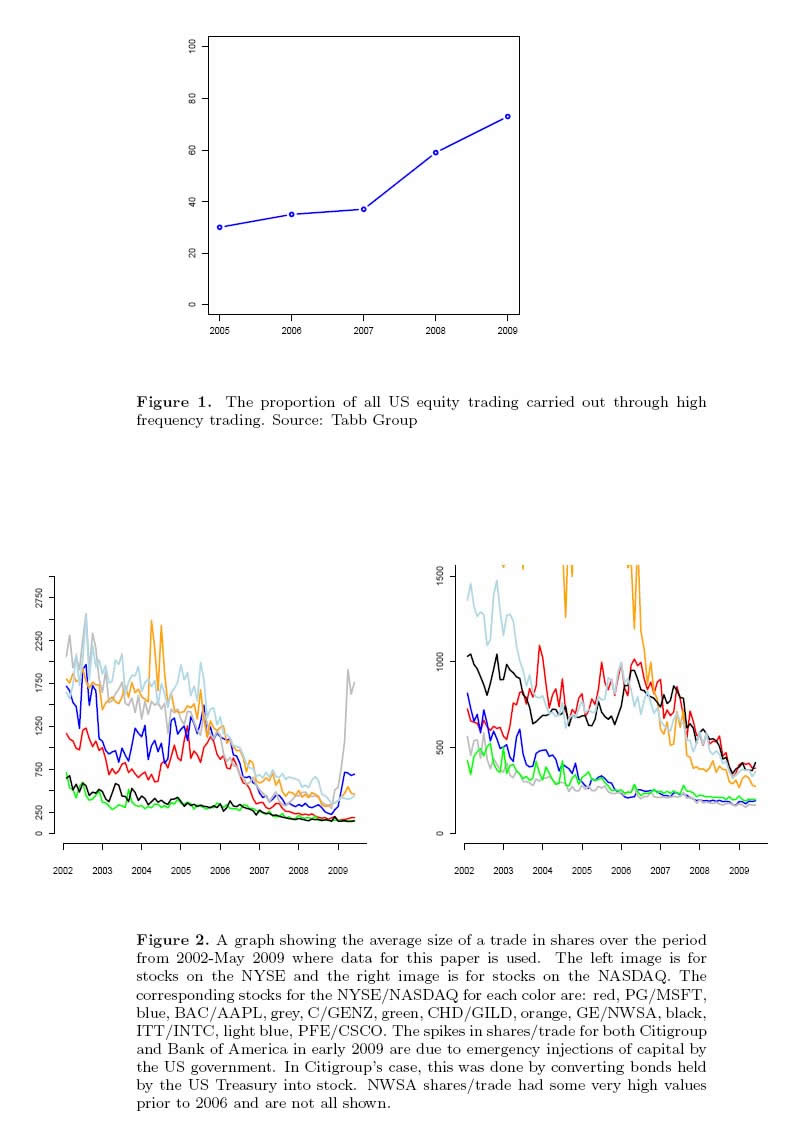
Top Graph - HFT % of U.S. Equity Market
Bottom Left - Average Trade Size in NYSE
Bottom Right - Average Trade Size in NASDAQ


     Given the above information, one may conclude that we are currently on the verge of the stock market equivalent of "sudden cardiac death", but that's not entirely accurate. Although the dominance of HFT in the market has helped destroy healthy variability, it is not the root cause of systemic instability. That designation is more appropriately reserved for the decades-long credit (complexity) bubble which has ensued all around the world, but especially in the United States. The reality is that the "critical point" for U.S. financial markets was already reached in 2008, and as most Americans are aware, the markets almost died back then. Cue the federal government and federal reserve, which provided trillions in "liquidity" to artificially create the variability that had been lost. The politicians and central bankers would like to think of themselves as the defibrilator that has sparked the financial "heart" back into a healthy rhythm. However, that analogy is simply not accurate, as evidenced by the current equity market's painfully boring microstructure. They are more like the artificial respirator that is keeping the brain-dead markets "technically" alive. Their tireless efforts are simply masking the terminal reality that lies underneath, and now we're all just waiting for someone or something to finally pull the plug. 

Ashvin Pandurangi, third year law student at George Mason University
Website: "Simple Planet" - peakcomplexity.blogspot.com (provides unique analysis of economics, finance, politics and social dynamics in the context of Complexity Theory)

© 2010 Copyright Ashvin Pandurangi to - All Rights Reserved Disclaimer: The above is a matter of opinion provided for general information purposes only and is not intended as investment advice. Information and analysis above are derived from sources and utilising methods believed to be reliable, but we cannot accept responsibility for any losses you may incur as a result of this analysis. Individuals should consult with their personal financial advisors.


© 2005-2022 http://www.MarketOracle.co.uk - The Market Oracle is a FREE Daily Financial Markets Analysis & Forecasting online publication.


Post Comment

Only logged in users are allowed to post comments. Register/ Log in