Sentiment Indicators Signaling a Major Stock Market Top
Stock-Markets / Stock Markets 2010 Nov 03, 2010 - 08:27 AM GMTBy: Claus_Vogt
 The S&P 500 index is nearly back to its April high. In the bigger picture the market can be seen as tracing out a major topping formation lasting nearly one year. Valuations are historically high, and macroeconomic leading indicators are showing a considerable recession risk.
Additionally, liquidity indicators like money supply and credit growth have deteriorated markedly for many months. To me this market looks ready for its next major cyclical bear market move.
But these fundamental indicators are not enough to forecast medium-term stock market behavior. You have to add some technical analysis to the mix to get a better picture of where the markets are going.
So today I want to discuss a special group of technical analysis: Sentiment indicators.
A Quick Look at the Technical Situation
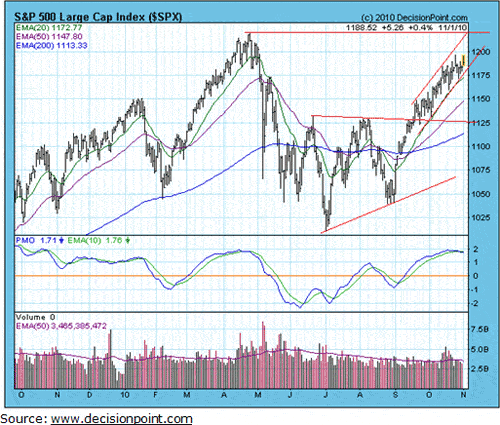
First let’s have a quick look at the S&P 500 chart below. Here you can see the rally of the past two months, which is still shy of the April high. But notice the Price Momentum Oscillator (PMO) in the middle panel … it shows a market as overbought as it was in April. And PMO has just given a crossover sell signal.
|
Now down to the lower panel, showing volume behavior. During the rally off the August low, volume was extremely lackluster … a bearish sign. But it was very fitting for what may turn out to be the right shoulder of a head-and-shoulders top or the second top of a double-top formation.
Even more conspicuous is the pickup in volume when prices reached the resistance area of around 1,080 points. Suddenly market activity increased, but prices stalled. This is a typical sign of distribution and another technical warning.
Fund Managers as Bullish as They Come
Now let’s look at some sentiment indicators. I have written about them in past Money and Market columns, but I think it’s worth repeating.
The mutual fund cash quote hit a record low of 3.4 percent in March, shortly before the market’s April high. Then it edged a bit higher; now it’s back down to 3.5 percent.
Fund managers are one of the most important groups of market participants. When they’re as fully invested as they are now, you have to ask yourself: Who is left to push prices higher? And how many can step in with buy orders in case the markets start declining?
This extremely low cash quote is a very bearish sign. It’s strongly supporting my thesis that the stock market is indeed in the process of building a major topping formation.
Individual Investors Are Very Bullish, Too …
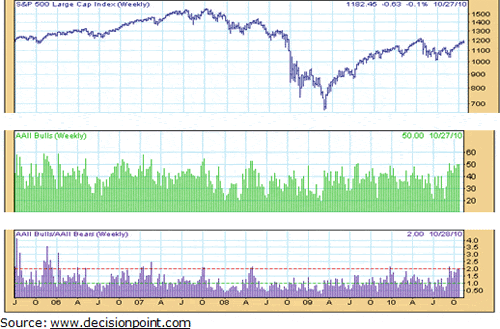
Investors, as measured by the American Association of Individual Investors (AAII) sentiment indicator, are also back in a bullish mode.
As of October 27, the bullish percentage rose to 52 percent, whereas bears are down to 22 percent … a 2.37 bull-to-bear ratio. A ratio of more than two is dangerously high as you can see in the bottom panel of the following chart.
|
Here, too, a strong argument can be made that this high degree of bullishness is especially worrisome since it is not accompanied by the stock market hitting new highs for the cycle, but only during a trading range. Without a doubt, sentiment seems to have outgrown reality.
The sentiment indicator compiled by Investor Intelligence can also be seen as a confirmation of too much complacency. This indicator measures stock market newsletters and shows a bull-to-bear ratio of 2 to 1. That’s lower than the 3 to 1 reading reached earlier this year and late last year — when the left shoulder was forming.
But the history of this indicator shows we should not expect it to hit another extreme during a huge topping formation …
That’s because market newsletter writers consist of many contrarians and mavericks who are not as susceptible to herding as fund managers or individual investors.
|
Insiders Are Bailing Out Like Never Before!
There is another group of market participants who is relatively less prone to herding behavior. I’m talking about the well-informed insiders, directors and managers.
Their behavior can give you instructive insights into what is really going on in corporate America. They usually know more about how their business is going than any outside expert or analyst.
Stock market newsletter publisher Alan Newman from Crosscurrents has written extensively about insider selling in his recent issue. His findings are stunning to say the least: Going back all the way to 1990 insider selling has never been as intense as during the past weeks.
So there you have it: Fund managers, individual investors, and stock market newsletter writers are anywhere from moderately bullish to very bullish.
At the same time, insiders are selling stock as if there was no tomorrow! Based on my fundamental indicators and technical analysis, I think the right thing to do here is to consider following the insiders and sell.
Best wishes,
Claus
This investment news is brought to you by Money and Markets. Money and Markets is a free daily investment newsletter from Martin D. Weiss and Weiss Research analysts offering the latest investing news and financial insights for the stock market, including tips and advice on investing in gold, energy and oil. Dr. Weiss is a leader in the fields of investing, interest rates, financial safety and economic forecasting. To view archives or subscribe, visit http://www.moneyandmarkets.com.
© 2005-2022 http://www.MarketOracle.co.uk - The Market Oracle is a FREE Daily Financial Markets Analysis & Forecasting online publication.


