Fed QE2 $600 Billion of Money Printing Over the Next Eight Months
Commodities / Gold and Silver 2010 Nov 11, 2010 - 01:23 PM GMTBy: Gary_Dorsch
 Crossing the Rubicon into the World of QE - “Imagination is more important than knowledge,” the brilliant Albert Einstein used to say. Imagine for just a moment that the Dow Jones Industrials has become a key instrument of national economic policy, and that by “actively managing” its direction, the Federal Reserve could impact the wealth of tens of millions of US households, and by extension, influence consumer confidence and spending. By ramping up the money supply, and slashing interest rates to zero percent, in order to inflate stock market bubbles, the Fed could in theory, fuel an economic rebound.
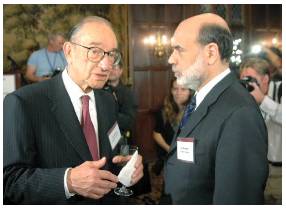
Former Fed chief “Easy” Al Greenspan used to pursue an “asymmetric” monetary policy, - that is to say, - always quick on the trigger to slash interest rates whenever the stock market was melting down, but very slow to lift interest rates, when stock markets were booming. Traders coined the term – the “Greenspan Put,” to describe the Fed’s propensity to rescue the markets with huge injections of liquidity.
Under Fed chief Ben “Helicopter” Bernanke, speculators have celebrated the easiest monetary policy in history, which earned Mr Bernanke the designation of Time magazine’s “Man of the Year,” in 2009, because of his love affair with running the printing press at maximum speed. After the Fed slashed the federal funds rate to zero-percent in December 2008, the Fed unveiled its nuclear weapon, “quantitative easing,” (QE), in order to jig the stock markets higher.
 Conspiracy theorists have long talked about the clandestine activities of the “Plunge Protection Team,” (PPT), - a shadowy group of agents, acting at the direction of the Fed and US-Treasury, that coordinates the targeted buying of billions of dollars in stocks and stock index futures to cushion the stock-market during sell-off’s, and to prevent outright meltdowns. The PPT operates 24-hours per day, and often, buying spree kicks in during the last hour of NYSE trading, and thinly traded Asian hours, creating a short squeeze on bearish speculators.
But now, with the implicit guarantee of the “Bernanke Put,” backed by the promise of zero-percent borrowing costs for years to come, it’s increasingly apparent that the Fed is in the business of rigging the stock market. It’s simply not wise to “Fight the Fed.” The conspiracy theories about the mythical PPT, were given an added degree of credibility on Nov 3rd, when Bernanke wrote in the Washington Post, that jigging-up the stock market, was in fact, the Fed’s key mechanism for bringing down the jobless rate, and spurring an economic recovery.
“Easier financial conditions will promote economic growth. Lower corporate bond rates will encourage investment. And higher stock prices will boost consumer wealth and help increase confidence, which can also spur spending,” Bernanke wrote, describing the “wealth effect.” Absent an economic recovery by early next year, bond dealers are already forecasting $400-billion for QE-3.
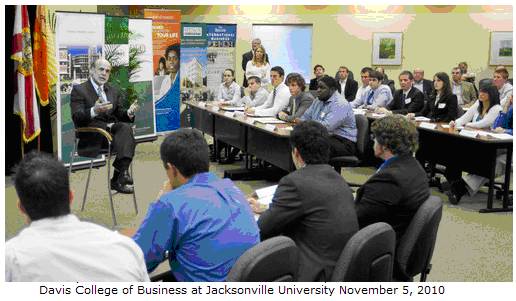
On Nov 5th, Professor Bernanke traveled to Jacksonville University in Florida. He tried to explain to a class of students, the basic principles of “Bubble” Economics. “We see an economy which has a very high level of under-utilization of resources and a relatively slow growth rate. The standard considerations suggest we should be using expansionary monetary policy, and that’s the purpose of QE-2. This sense out there, that QE is some completely far removed, strange kind of thing, and we have no idea what the hell is going to happen, and it’s just an unanticipated, unpredictable policy, quite the contrary. This is just monetary policy,” he said.
Recounting his famous “Helicopter” speech in Nov 2002, Bernanke explained, “If pernicious deflation does take hold in the economy, there is a way out of the trap. You see, US-dollars have value only to the extent that they are strictly limited in supply. And the US-government has a technology, called a printing press that allows it to produce as many US-dollars as it wishes at essentially no cost. By increasing the number of US-dollars in circulation, or even by credibly threatening to do so, the Fed can also reduce the value of a dollar in terms of goods and services, which is equivalent to raising the prices in dollars of those goods and services.”
 “If we do fall into deflation, we can take comfort that the logic of the printing press must assert itself, and sufficient injections of money will ultimately always reverse a deflation. Under a paper-money system, a determined government can always generate higher spending and hence positive inflation. A principal message of my talk today is that a central bank whose accustomed policy rate has been forced down to zero has most definitely not run out of ammunition,” Bernanke concluded.
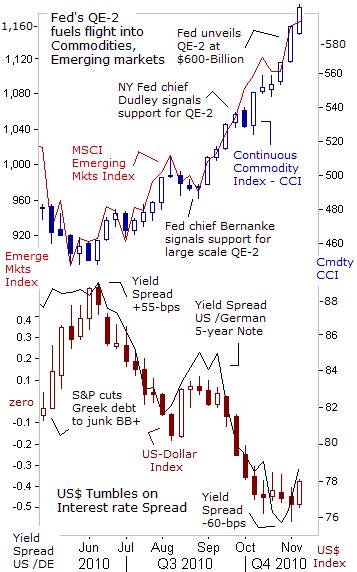
Eight-years since Bernanke delivered his trademark “Helicopter” speech – his theories are being put into action. QE-1 and future QE-2 have lifted the Dow Jones Industrials above the 11,400-level, recouping all of its losses, following the default of Lehman Brothers. Likewise, the US-dollar has tumbled to below parity with the Australian and Canadian dollars and sunk to a 15-year low of 80-yen. Gold soared above $1,400 /oz, and silver hit $29.25 /oz, its highest in 30-years. While the Fed can unleash a tsunami of liquidity, it can’t always direct where the money flows.
One of the students at Jacksonville, commented that even before the radical QE-2 experiment officially begins, there’s already been an upward explosion in the prices of a wide array of commodities, including crude oil, corn, cotton, copper, cattle, gold, heating oil, gasoline, rubber, nickel, tin, palladium, silver, soybeans, rice, and wheat. The Continuous Commodity Index (CCI) is skyrocketing in a V-shaped parabolic rally and is +84% above its Dec 2008 low. Perhaps, these forward looking market signals could become a harbinger of an outbreak of virulent inflation?
Bernanke replied that fast growing economies, such as China and India’s, are behind the strong demand for commodities, and pushing-up prices, but the Fed thinks most of the increases would not be passed on to US-consumers. Making an exception for energy costs, Bernanke said, “Our research and our experience suggest that, broadly speaking, when you have a situation like we have today, where there’s a lot of slack in the economy, a lot of excess supply, that it’s very, very, difficult for producers to push through those costs to the final consumer,” he said.
The students were reminded that the Fed’s preferred indicator of inflation doesn’t include volatile food and energy costs. Yet it would be naïve to ignore the fact that the sharp drop in the value of the US-dollar is contributing to the sharp upward trajectories of many commodities. It’s also fueling a “carry trade” that is attracting “hot money” flows into emerging stock markets. Traders are borrowing US$’s at near zero-percent, and re-investing the funds in higher yielding currencies, emerging stocks, gold, and commodities. In fact, much of the liquidity from QE-2 might simply find its way into foreign economies, - and not America’s.
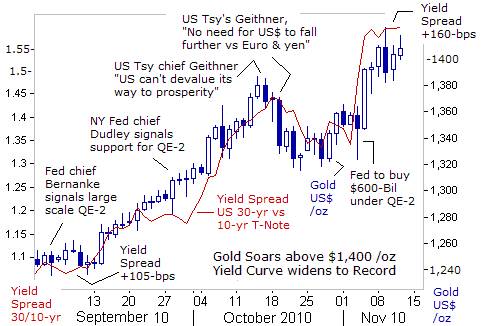
Gold Climbs above $1400 /oz, US-Treasury’s Yield Curve widens, There are other key indicators in the marketplace that are flashing yellow lights, warning that a major outbreak of inflation looms on the horizon. The yield spread between the 10-year US-Treasury note and 30-year bond has widened 55-basis points (bps) to an all-time high of +160-bps, amid fears of accelerating inflation.
Recently, the price of Gold has closely tracked the twists and turns in the Treasury’s yield curve, on its journey to $1,400 /oz. Clearly, QE-2 has dealt a severe blow to the long end of the Treasury yield curve, especially for maturities beyond 10-years. Given the hyper-inflationary implications of the Fed’s QE-2 scheme, investors prefer wealth preserving assets, such as gold and silver, rather than holding long-term US-Treasury bonds, that could eventually begin to resemble Zimbabwe’s debt.
On Nov 9th, Tea Party favorite Sarah Palin lashed out at Fed chief Bernanke and his radical band of inflationists, - calling upon them to “cease and desist,” from monetizing the national debt. “We shouldn’t be playing around with inflation. We don’t want temporary, artificial economic growth bought at the expense of permanently higher inflation which will erode the value of our incomes and our savings. We want a stable dollar combined with real economic reform. It’s the only way we can get our economy back on the right track,” Palin said.
Ron Paul, R-Texas, said on Nov 8th, the Fed will eventually destroy the US-dollar’s value around the world. “Bernanke is very clear at what he’s going to do. He’s going to create money until he gets economic growth, but there’s no evidence creating money creates economic growth.” Asked about Bernanke’s statement that he’s aiming for 2% inflation, Paul said: “When he gets to four percent, he’ll decide to go to eight, and there’s no way they can stop it. If they withdraw, it might make things worse. They think they have control. They don’t,” he warned.
“The German finance minister called the Fed’s proposals clueless. When Germany, a country that knows a thing or two about the dangers of inflation, warns us to think again, maybe it’s time for Chairman Bernanke to cease and desist,” Palin said. Paul Ryan, the next likely chairman of the House budget committee starting in January, said, “I think it’s going to give us a big inflation problem down the road.”
 At a Nov 6th meeting on Jekyll Island, Georgia, Bernanke tried to deflect mounting criticism over QE-2. “We’re not in the business of trying to create inflation. I reject any notion that we are going to try to raise inflation to a super-normal level in order to have effects on the economy.” However, St Louis Fed chief James Bullard said his best guess is that the full amount of QE-2, - $600-billion of fresh cash, would be injected into the markets by mid-2011. “Given the outlook now, it looks like we will follow through on that and reassess at that point,” he said.
So far, QE-1 combined with expectations of QE-2, have successfully enabled the Dow Jones Industrials to recoup its post Lehman Brothers’ losses. How can anyone doubt the power of the Fed’s printing presses? However, there are definite risks that go along with the magic elixir of Zimbabwe-type QE, such as the outbreak of virulent inflation, and capital flight from the local bond market, when the central bank states its goal of monetizing $1-trillion plus budget deficits.
Although a widening yield curve, alongside a booming stock market, might be viewed as a harbinger of a stronger economy, - there are dangers lurking beneath the surface. The US Treasury’s 30-year bond yield has risen 75-basis points to 4.25%, since the Fed started telegraphing QE-2. Also, over the past three-weeks, the yield on Ireland’s 10-year bond has soared 312-bps to 9.12% today. In a replay of the Greek debt crisis, the Euro is tumbling sharply lower, and rattling S&P-500 multinationals. As the Fed crosses the Rubicon into the world of QE-2, one has to wonder if the US-T-bond market could be the next target of the infamous bond vigilantes that are bludgeoning the Greek and Irish bond markets this week.
Commodity Inflation Sweeps across China
On Nov 9th, Chinese Vice-Premier Wang Qishan warned that because of the Fed’s QE-2 scheme, “emerging economies are seeing large capital inflows and face mounting inflationary risks. There is excessive liquidity in the world and fluctuations in international financial markets.” The Shanghai stock index has gained 18% since the start of September, and prices for grains, cotton, rice, rubber, copper, sugar, and steel on China’s futures exchanges are soaring into the stratosphere.
China’s voracious appetite for raw-materials now accounts for 35% of global demand for base metals and 40% for cotton. China will probably buy about one-third of the US-soybean crop this year, whittling down US-inventories of corn and soybeans to dangerously low levels. And as China’s demand continues to expand, trade volumes on the Shanghai and Dalian commodity exchanges will increase, and would greatly influence prices on Western markets, including the London Metal Exchange.
China and India are the world’s top consumers of natural rubber, with demand driven by the auto industry. Rubber futures in Shanghai rose above 38,400-yuan /ton this week, up from 23,000 –yuan just three-months ago. In the 1980’s, China had a marginal influence on the copper market, accounting for only 10% of the global demand. Now, China is buying 35% of the world’s copper output. Copper jumped above $4 /lb in New York, up sharply from a low of $1.250 two-years ago.
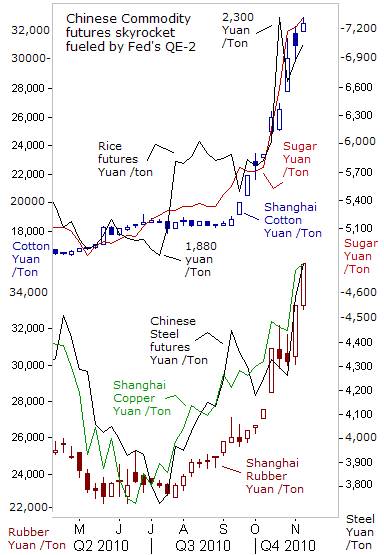
China is also the world’s largest consumer of rice, and prices of the world’s top staple food are up 35% from four months ago. Half of China’s rice ends up being traded on grain markets, rather than consumed locally. China is the fourth country to launch grain futures trading. The United States, Thailand (the world’s #1 rice exporter) and India (the #2 rice producer) also have rice futures contracts.
The price of cotton has reached the highest levels since the American Civil War. At the nadir of the Global Recession, cotton futures dipped below 40-cents a pound in New York. This week, they were selling for $1.46 a pound. In a normal year, cotton sells for 50-cents to 80-cents a pound. But now, the center of gravity in cotton has shifted to China, - the biggest producer, the biggest processor, and the biggest importer, and the biggest factor in the jump in cotton’s price.
Global cotton supplies were reduced this year by Pakistan’s massive floods and by India's decision to restrict cotton exports. China maintains strategic stockpiles of many commodities, including cotton. To meet demand from textile companies, the Beijing has auctioned 16-million bales of cotton from its strategic stockpiles, since May 2009. That’s close to what US farmers grow in a year. As those stocks deplete, China has been willing to buy cotton at any price. Clothing manufacturers and retailers are going to have to raise prices.
Chinese citizens are buying more clothing as they increase their wealth. The average consumer in China now buys 4.4-pounds of cotton a year. The average American purchases 33-pounds. If Chinese consumption rises to US-levels, it would require growing an extra 80-million bales of cotton each year somewhere in the world, while global production is about 117-million bales.
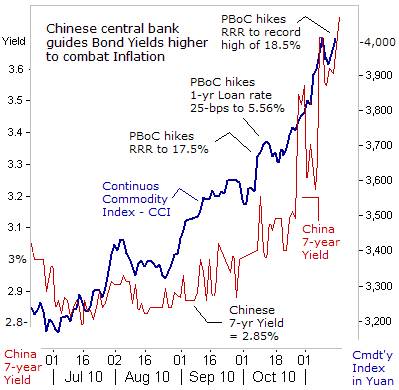 The Continuous Commodity Index (CCI) index has rallied for 11 straight weeks, its longest streak since 1977. In the US, traders have plowed $320-billion into commodities and related ETF’s banking on the inflationary power of the Fed’s QE-2 scheme. Soaring commodity prices have pushed China’s annualized inflation rate, to +4.4% in October, well above Beijing’s annual target of 3% for 2010. More recently, prices of China’s farm produce have jumped 5% since mid-October, and China’s M2 money supply is +19.3% higher than a year ago.
A top Chinese central banker, Ma Delun, warned the People’s Bank of China (PBoC) will not leave inflation unchecked. On Nov 10th, the PBoC ordered the country’s biggest banks, banks to set aside an additional 1% of their customer deposits with the central bank, in order to shrink the pool of yuan available for lending. The extra tightening step takes the required reserve ratio (RRR) to a record 18.5%, and would drain a massive 600-billion yuan ($90-billion) out of circulation.
On October 20th, the PBoC hiked bank deposit rates by 25-bps to 2.50%, the first interest rates hike in three years, and began to guide longer term bond yields higher, to discourage traders from speculating in commodities and Shanghai red-chips. China’s benchmark 7-year bond yield jumped to 3.75% this week, but still remains far below the inflation rate, making gold, commodities, and natural resource shares more attractive to stay ahead of the rising cost of living.
Crude Oil Zeroes in on $90 /barrel, Since Bernanke and former Goldman Sachs partner William Dudley telegraphed their support for QE-2, the price of crude oil has rallied $12 /barrel to over $88 /barrel today. Likewise, the price of wholesale unleaded gasoline has increased by 40-cents /gallon. Recognizing the Fed’s intention to devalue the dollar, the OPEC hawks convinced Saudi Arabia to raise the upper target ceiling for crude oil by $10 to $90 /barrel.
“An oil price between $70 and $90 a barrel is a comfortable range for consumers, said Saudi Oil Minister Ali al-Naimi on Nov 1st, marking a step up from OPEC’s previous target zone of $70-$80 /barrel. Oil prices are going up, even though OPEC is producing 1.9-million barrels per day of extra supply beyond its stated quotas. But OPEC isn’t worried about its members’ compliance with its quotas right now.
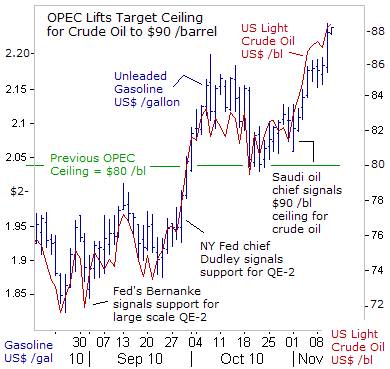 Instead, it’s all about the Fed’s QE-2-scheme, because as the US-dollar weakens, oil prices go up. “The real price of oil should be about $20 less than current levels,” said Venezuelan Energy and Oil Minister Rafael Ramirez. OPEC’s Abdullah al-Badri added, “Even if the oil price reaches $90, it will not hinder world growth.” If the rest of the G-20 central banks were to engage in money printing, to counter the Fed’s QE-2, oil prices could climb above $100 /barrel, even if the US-economy stays weak.
Thus, while QE-1 rescued the US-economy from a Great Depression, and restored tranquility to the credit markets, the Fed’s decision to cross the Rubicon into the world of QE-2, might leave the economy worse off, - stuck in the “Stagflation” trap. Among the possible outcomes of QE-2 are a global “Oil Shock” lifting crude oil above $100 /barrel, and sharply higher 30-year T-bond yields. As rapidly rising consumer prices outstrip wages, thus shrinking disposable income, while Wall Street basks in the glow of QE-2, and banks gets another clandestine bailout, there’ll be another public uprising, and this time, - it might not be confined to the voting booth.
This article is just the Tip of the Iceberg of what’s available in the Global Money Trends newsletter. Subscribe to the Global Money Trends newsletter, for insightful analysis and predictions of (1) top stock markets around the world, (2) Commodities such as crude oil, copper, gold, silver, and grains, (3) Foreign currencies (4) Libor interest rates and global bond markets (5) Central banker "Jawboning" and Intervention techniques that move markets.
By Gary Dorsch,
Editor, Global Money Trends newsletter
http://www.sirchartsalot.com
GMT filters important news and information into (1) bullet-point, easy to understand analysis, (2) featuring "Inter-Market Technical Analysis" that visually displays the dynamic inter-relationships between foreign currencies, commodities, interest rates and the stock markets from a dozen key countries around the world. Also included are (3) charts of key economic statistics of foreign countries that move markets.
Subscribers can also listen to bi-weekly Audio Broadcasts, with the latest news on global markets, and view our updated model portfolio 2008. To order a subscription to Global Money Trends, click on the hyperlink below, http://www.sirchartsalot.com/newsletters.php or call toll free to order, Sunday thru Thursday, 8 am to 9 pm EST, and on Friday 8 am to 5 pm, at 866-553-1007. Outside the call 561-367-1007.
Mr Dorsch worked on the trading floor of the Chicago Mercantile Exchange for nine years as the chief Financial Futures Analyst for three clearing firms, Oppenheimer Rouse Futures Inc, GH Miller and Company, and a commodity fund at the LNS Financial Group.
As a transactional broker for Charles Schwab's Global Investment Services department, Mr Dorsch handled thousands of customer trades in 45 stock exchanges around the world, including Australia, Canada, Japan, Hong Kong, the Euro zone, London, Toronto, South Africa, Mexico, and New Zealand, and Canadian oil trusts, ADR's and Exchange Traded Funds.
He wrote a weekly newsletter from 2000 thru September 2005 called, "Foreign Currency Trends" for Charles Schwab's Global Investment department, featuring inter-market technical analysis, to understand the dynamic inter-relationships between the foreign exchange, global bond and stock markets, and key industrial commodities.
Copyright © 2005-2010 SirChartsAlot, Inc. All rights reserved.
Disclaimer: SirChartsAlot.com's analysis and insights are based upon data gathered by it from various sources believed to be reliable, complete and accurate. However, no guarantee is made by SirChartsAlot.com as to the reliability, completeness and accuracy of the data so analyzed. SirChartsAlot.com is in the business of gathering information, analyzing it and disseminating the analysis for informational and educational purposes only. SirChartsAlot.com attempts to analyze trends, not make recommendations. All statements and expressions are the opinion of SirChartsAlot.com and are not meant to be investment advice or solicitation or recommendation to establish market positions. Our opinions are subject to change without notice. SirChartsAlot.com strongly advises readers to conduct thorough research relevant to decisions and verify facts from various independent sources.
Gary Dorsch Archive |
© 2005-2022 http://www.MarketOracle.co.uk - The Market Oracle is a FREE Daily Financial Markets Analysis & Forecasting online publication.


