


Gold Price Worst Plunge Since February, Will it Do the Same Again?
Commodities / Gold and Silver 2010 Nov 14, 2010 - 11:39 AM GMTBy: Merv_Burak

 Ouch! That was some decline on Friday, the worst single day decline since early Feb. The Feb decline ended the next day and gold took off for a $350 advance until this past week. Will it do the same again?
GOLD : LONG TERM
A day or two does not change the long term prognosis unless we have already had much negative action prior to the latest. So, the long term point and figure chart remains as it was last week while the indicators have not changed their message, although they might have firmed up a bit. Gold price remains comfortably above its positive sloping moving average line with no indication that it will plunge below the line very soon. The volume indicator is also in new high ground above its positive long term trigger line. It’s the momentum indicator that is changing, as one would expect.
The momentum indicators are usually the first indicators to provide some hint of problems ahead, although one would not trade based upon the message of a momentum indicator alone. The long term momentum indicator is in its positive zone but underperforming the price action. It has given us a negative divergence warning versus the early Oct top and has now dropped back below its trigger line. With a basic lateral drift over the past few weeks the momentum trigger line has turned horizontal and Friday’s indicator move below the trigger line has turned the line negative. This is, so far, the only negative long term warning so not to panic yet. Putting all of these indicators together the long term rating still remains BULLISH.
INTERMEDIATE TERM
On the intermediate term things are about the same as for the long term, the only slight difference is that the momentum indicator is much closer to breaking below its Oct lows for a stronger warning signal. For now, gold price remains above its positive moving average line. The momentum indicator remains in its positive zone although it has dropped below its trigger line and the trigger has turned downward. The momentum has also given us a negative divergence warning, similar to the long term indicator. As for the volume indicator, it remains above its positive trigger line and still quite positive. All in all, the intermediate term rating remains BULLISH. The short term moving average line continues to confirm this rating by remaining above the intermediate term line.
SHORT TERM
This is where we really get our first serious warning if things are going to turn ugly. The short term should be the first to turn negative and it has. The price of gold has dropped below its short term moving average line and the line has turned downward at the same time. The momentum indicator is still very, very slightly in its positive zone but moving lower fast and has moved below its negative trigger line. The negative divergence mentioned in the previous sections can be seen here also. With the daily volatility in the market it’s kind of difficult to
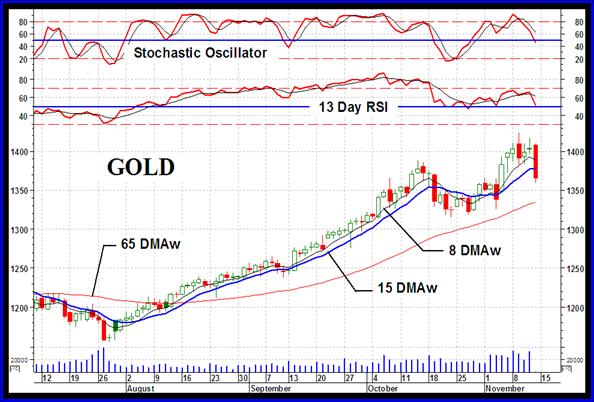
decipher the meaning of the daily volume action so I’ll leave that part out. Overall, the short term rating has now turned to the BEARISH side. Although the very short term moving average has turned downward it has not yet crossed below the short term average for confirmation of the bear. That might come with another day or two of downside price action.
As for the immediate direction of least resistance, that would now be to the down side. The Stochastic Oscillator has now entered its negative zone and heading lower. Gold has dropped below the very short term moving average line and the line has turned downward. The strength seems to lie with the down side.
SILVER
Silver continues to out perform gold except that this week it was out performing gold on the down side, not by much but still taking a bigger hit than gold. Silver stocks, however, do not seem to know that silver took a hit this week. Both the Qual-Silver and Spec-Silver Indices were up on the week, Spec-Silver by more than 3%. The more speculative silver stocks continue to be where the action is (along with the Penny Arcade stocks).
Comparing the two short term charts, gold and silver, there are many similarities but also some differences in their market action. The silver action since the Oct lows was a lot more vigorous than the gold action but still the short term momentum indicator gave us a negative divergence similar to gold. However, looking at the intermediate and long term momentum indicators (not shown) they are a lot stronger than gold’s momentum indicators. Neither the intermediate nor
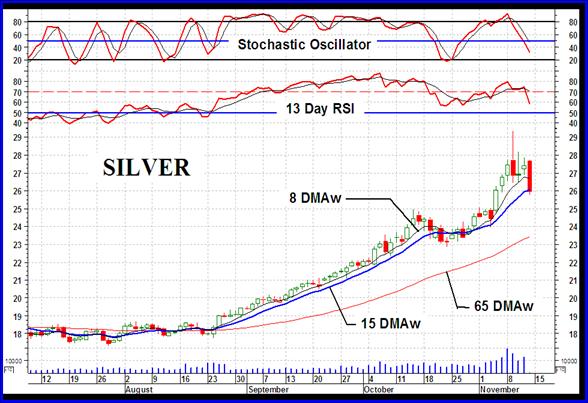
the long term silver indicators have given us a negative divergence, so for now it’s only a short term warning. One should not take this as silver possibly moving counter to gold. Silver is often considered as a younger brother to gold and when gold makes its move so would silver. The only point here to consider is that although the two would end up moving in the same direction it is inevitable that one will move more emphatically than the other. My guess is that despite the direction of the move silver will remain a better bet than gold, very short term considerations excepted.
As mentioned, the silver indicators are very similar to those of gold mentioned earlier. The one basic difference is in the short term indicators. Here the silver price has just crossed below its short term moving average line but the line slope is still to the up side. This results in a slightly better rating giving silver a short term rating of – NEUTRAL (versus gold’s bear). For the other time periods the ratings are still at a BULLISH level.
PRECIOUS METAL STOCKS
Shown last week was my Merv’s Spec-Silver Index of 25 speculative silver stocks. The Index was in a gung-ho up trend. This week, although not a good week for most Indices, this Index had another good week gaining 3.7% on the week while most other Indices (except the Penny Arcade Index) were either on the losing side or gaining mere fractions of a percent. It remains a speculative trader’s market.
I have great faith in those speculators who are able to move markets. As long as they continue to have faith in the speculative and gambling stocks and are moving that sector higher I see no problem with the majority of the full spectrum of precious metal stocks continuing to advance, short term problems or not. It’s when the speculative and gambling variety of stocks start to decline because these speculators start to lose their faith in them that we have to really worry about the universe of precious metal stocks. When faith is lost in the market it is first lost in the most speculative sectors before the better quality stocks. I would recommend watching what is happening to my Merv’s Penny Arcade Index, Merv’s Spec-Silver Index and Merv’s Gamb-Gold Index. These three Indices represent the speculative and gambling sectors of the precious metals stocks.
It should be noted that the FTSE Indices in the table are for trading up to Thursday’s close and do not include the effects of the Friday drubbing.
Merv’s Precious Metals Indices Table
Well, that’s it for this week. Comments are always welcome and should be addressed to mervburak@gmail.com.
By Merv Burak, CMT
Hudson Aero/Systems Inc.
Technical Information Group
for Merv's Precious Metals Central
For DAILY Uranium stock commentary and WEEKLY Uranium market update check out my new Technically Uranium with Merv blog at http://techuranium.blogspot.com .
During the day Merv practices his engineering profession as a Consulting Aerospace Engineer. Once the sun goes down and night descends upon the earth Merv dons his other hat as a Chartered Market Technician ( CMT ) and tries to decipher what's going on in the securities markets. As an underground surveyor in the gold mines of Canada 's Northwest Territories in his youth, Merv has a soft spot for the gold industry and has developed several Gold Indices reflecting different aspects of the industry. As a basically lazy individual Merv's driving focus is to KEEP IT SIMPLE .
To find out more about Merv's various Gold Indices and component stocks, please visit http://preciousmetalscentral.com . There you will find samples of the Indices and their component stocks plus other publications of interest to gold investors.
Before you invest, Always check your market timing with a Qualified Professional Market Technician
Merv Burak Archive |
© 2005-2022 http://www.MarketOracle.co.uk - The Market Oracle is a FREE Daily Financial Markets Analysis & Forecasting online publication.