


Poverty in America, The Big Picture
Politics / US Politics Nov 14, 2010 - 12:42 PM GMTBy: Mike_Stathis

 In America’s Financial Apocalypse, a book that has been banned by the media, I discussed the many flaws in the calculation of poverty levels within the U.S. First, let’s have a look at some excerpts from the book.
“In August 2004, the U.S. Census Bureau reported a poverty rate of 12.7 percent. This was the rate used by government economists and politicians to determine expenditures for numerous government programs.
However, the Census Bureau added that this rate could be as high as 19.4 percent or as low as 8.3 percent depending on how income and basic living expenses were treated.
I for one feel that the real poverty rate in America is much closer to the 19.4 percent figure (and most likely even higher) due to the unwillingness of Washington to update its criteria for poverty levels.
And over the next two decades, as the majority of America’s estimated 76 million baby boomers are expected to retire in poverty, the real poverty numbers could easily surpass 30 percent (more on this in Chapters Eight and Nine). According to the U.S. Census’ conservative formula for poverty, in 2004 there were:
• 37.0 million Americans in poverty (12.7%), up from 35.9 million (12.5%) in 2003
• 7.9 million American families in poverty (10.2%), up from 7.6 million in 2003
As defined by the Office of Management and Budget and updated for inflation using the Consumer Price Index, the average poverty threshold for a family of four in 2004 was an income of $19,307; for a family of three, $15,067; for a family of two, $12,334; and for unrelated individuals, $9,645.
How is it that record oil prices have not allowed for upward adjustments in these levels? Keep in mind that inflation of basic necessities such as food, energy, and healthcare affects the poor by a much larger factor than wealthier Americans because they have less to spend on other items. Thus, inflation of basic necessities becomes a tax on low- and middle-income Americans.”
Source: America’s Financial Apocalypse, 2006.
Now, let’s examine the current data. The poverty threshold level for 2009 was less than $21,954 for a family of four in 2009 and $10,956 for an individual.
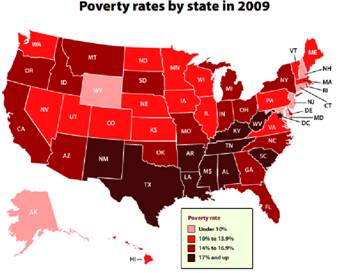
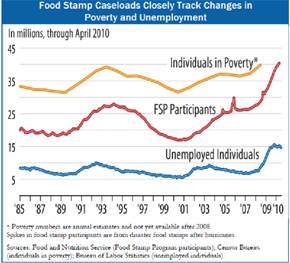
According to recent data released by the U.S. Census, the nation's poverty rate jumped to 14.3%, representing 43.6 million Americans in 2009. This is the highest level of poverty seen in the U.S. since 1994.
The poverty rate increased for all racial groups except Asians. Only five states had poverty rates of less than 10 percent in 2009 -- Alaska, Connecticut, Maryland, New Hampshire and New Jersey.
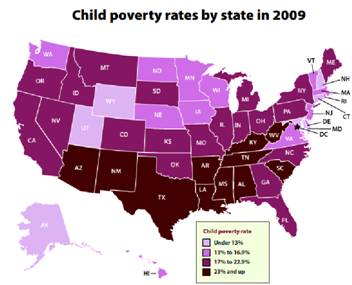
The poverty rate for children under age 18 grew faster in 2009 than it did for the population as a whole, increasing 1.7 percentage points to 20.7%.

The South remained the poorest area of the country, with a poverty rate of 15.7%. The South also experienced the largest increase in poverty, moving up 1.4 percentage points from 14.3% in 2008.
According to the data from the Census, the poorest state in the U.S. is Mississippi, with a 21.9% rate of poverty.
Notably, Arizona (19.6%) and New Mexico (19.3%) also recorded a much higher poverty rate than the national average.

As bleak as this data looks, the fact is that it represents gross understatements of the real picture, as I discussed in America’s Financial Apocalypse.
When the media reported the latest poverty data from the Census, an analyst from the Brookings Institution made a key statement.
“…the state comparisons may not be very fair. They make no provisions for differences in living costs. I think we need to revise the poverty measure to take into account regional cost differences.”
I made this statement myself four years ago in America’s Financial Apocalypse. Let’s have a look.
“Consider that it’s almost impossible for a single person to survive today in America with an annual income of $10,000; roughly the national minimum wage. The only exception might be if they live in the Deep South. And if they are surviving, they certainly don’t have funds needed to advance their employment options.
In many regions of America such as California, New York, and New Jersey, $10,000 per year won’t even cover your government-assisted housing, food and utilities. And you certainly won’t have anything left over for incidentals, such as laundry, clothes, transportation, etc.
It seems odd that the poverty level is not adjusted for the living expenses of each city or state since this would account for regions with higher living expenses. As it stands today, the government’s formula for poverty is only applicable to states with the lowest cost of living such as West Virginia, Mississippi, Arkansas, and Alabama. Yet, even in these states, poverty levels are quite high according to Washington’s conservative criteria. How many Americans living in larger, more costly metropolitan areas are making more than the government’s poverty level, yet are not counted in its official numbers?
In most areas of the United States, it takes roughly double the federal poverty level to provide a family with basic necessities such as food and housing, according to the National Center for Children in Poverty. Based on the government’s conservative data, nearly 40 million Americans are literally on the verge of being homeless. But if appropriate adjustments for basic living costs were made, the poverty level could easy be 80 percent higher than reported levels. Even with all the tricks government agencies use to hide the truth, they still can’t dispute that poverty is on the rise.”
Source: America’s Financial Apocalypse, 2006.
Based on estimates by several groups, the most recently reported poverty rate did not show as large of an increase as expected because of the decrease in poverty seen by elderly Americans who entered into Social Security and Medicare. Moreover, the extension of employment benefits by seven times and the economic stimulus package which saved millions of public jobs also keep poverty numbers from soaring.
However, as warned in AFA, Social Security cost of living adjustments (COLA) have not kept up with inflation for decades. We are now seeing a worsening of this situation, as Obama has halted the COLA for Social Security through 2011. This accounts for one reason why Washington has continued to understate the real inflation data.

The income used to calculate poverty status includes earnings, workman's compensation, unemployment insurance, Social Security, veteran's payments, pensions, interest and dividends, and just about every other source of cash. However, as mentioned in America’s Financial Apocalypse, the calculations do not include capital gains. Non-cash benefits, such as food stamps or subsidized rents, also do not count as income.
According to the Brookings Institution, poverty is expected to continue to reach a high of about 16% over the next decade, adding another 10 million Americans. If proper variables were factored into poverty calculations, we would surely see in excess of 25% poverty in the U.S. over this period. What does all of this mean? As I warned in AFA, combined with massive losses to retirement plans and pensions, further cuts to Social Security and Medicare promise to send the majority of baby boomers into poverty.
Things will be even worse for younger Americans, who will remain jobless or be forced to work in a job that pays poverty wages. Unlike the elderly, they won’t have Social Security income or Medicare. This is going to be a huge problem for many years to come.
The U.S. Census also recently reported income data for various cities and states. As you might have expected, Mississippi also lead the nation in getting hit with the largest declines in median income. Mississippi residents earned the lowest incomes in the U.S., with incomes falling to $36,646 in 2009 from $37,749 in 2008. In 2009, the median income in the U.S. was $50,221.
According to the Census, 29 states reported lower median incomes than the U.S. median, while 20 states and the District of Columbia reported higher median incomes than the overall median.
Real median household income decreased over the year in 34 states, and was relatively the same in 15 states and the District of Columbia.
Maryland had the highest median income in the country in 2009, at $69,272. Take a guess why. BLOATED FEDERAL GOVERNMENT WAGES.
The Census also indexed income inequality, looking for how income is distributed within a state.
Washington, D.C. had the largest income disparity in 2009, along with the territory of Puerto Rico. New York had the biggest income gap of the states followed by Connecticut.
Alaska had the smallest income inequality, followed by Utah.
Finally, I continue with additional excerpts from America’s Financial Apocalypse, which puts America’s wealth and income disparity into perspective.
“Washington likes to remind critics that Americans enjoy the highest living standard in the world. As evidence of this, government “experts” discuss statistics such as GDP growth, wealth, income and wage growth, and other economic indicators without defining exactly what they are referring to (see Chapter Eleven for a detailed discussion).
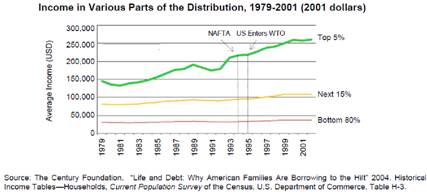
In fact, when one examines the data, it’s clear that only America’s wealthiest 5 percent have benefited from the credit-driven economic expansion that began over two decades ago.
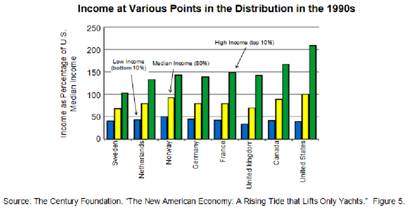
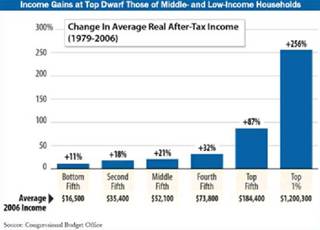
Shortly after 1980, real incomes of the top 5 percent of Americans soared over the next two decades from about 3.5 times to 5.5 times the median income (in 2001 dollars).”

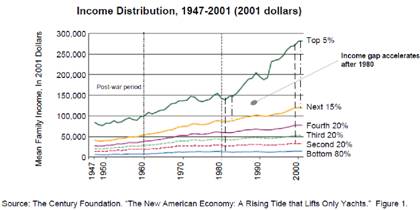
“In contrast, real incomes for the bottom 80 percent of Americans barely moved during this period, while inflation for basic necessities (such as healthcare, energy, and higher education) soared. These increased expenses have further reduced the disposable income of the majority of Americans. In contrast, the post-war economic expansion was much more evenly distributed across all wage earners. This balanced expansion continued until the high inflation period of the early ‘80s.
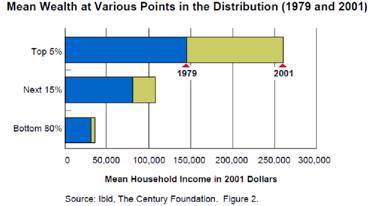
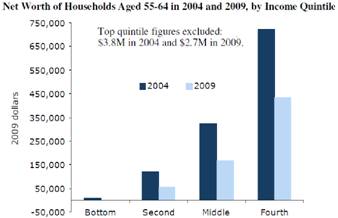
Even more disturbing is that America’s wealth disparity is much greater, with the top 5 percent having accounted for a much larger percentage of wealth growth from the decade since 1979 than the bottom 95 percent.
Ten years later, the results are even worse, with the wealthiest 5 percent of Americans having on average 23 times the wealth of the remaining 95 percent. The problem is that households with low net worth have very few assets and will therefore be affected more by price increases in basic necessities.
In addition, they will be less able to weather unexpected difficulties, such as medical emergencies or a job loss. Accordingly, Edward Wolff has estimated that 40 percent of households headed by individuals aged 25 to 54 could exhaust all of their financial assets (excluding their home) within 1 week if they lost their income.
While America’s wealthiest 5 percent have received a much greater percentage of the nation’s wealth for over two decades, the remaining 95 percent have benefited very little. When we compare top and bottom income and wealth levels to other nations, America begins to resemble the land of opportunity for only a select few.
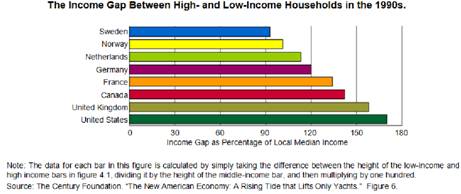
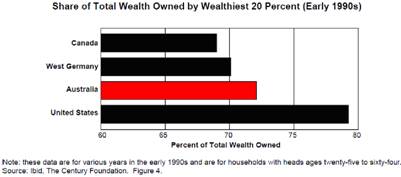
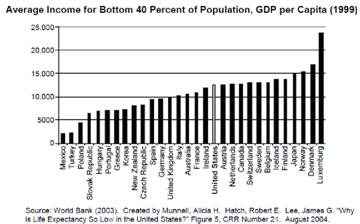
America’s poorest 10 percent has less purchasing power than almost every other developed nation. Meanwhile, its wealthiest 20 percent own almost 80 percent of all household wealth (figure 4-5). And compared to other developed nations, America has the largest income gap between the top 10 percent of income earners and the median income, as well as the largest gap between median income and the lowest 10 percent of income earners.”
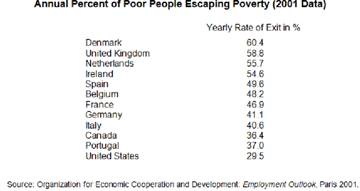
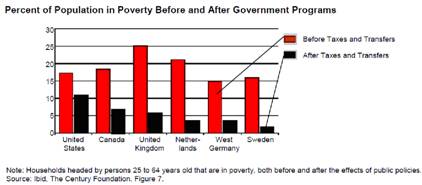
“Finally, the U.S. government does much less to help raise the living standards of its impoverished citizens compared to other developed nations.
What was once a nation of fairness, opportunity and moderation has become a nation of favoritism and extremes. Some view America’s economic strength to be confirmed by the annual growth of new millionaires. However, this has come at the expense of shifting more Americans into poverty or near poverty.
Two decades ago, most Americans began to use credit to purchase goods and services that they couldn’t afford. And during the 1990s, this greed became more intense. Today we see the effects of three decades of economic decline, as many now use their credit cards to pay for basic necessities.
To illustrate these consumption trends, consider the American staple; the house. Three decades ago, the average American family consisted of about 4.5 individuals with an average home size of about 2200 square feet.
Today, with about 3.6 family members, the average family now has a home that’s about 3500 square feet. That represents an increase in size (per individual) of 100 percent. Instead of having fewer bedrooms, the average home now has more. As well, today’s average new home has many additional rooms that didn’t exist in the past such as a study, an entertainment room, Jacuzzi room, and others.
These consumption trends have extended to the number and size of autos, televisions, and other goods purchased by the average American family.
Americans need to ask themselves if they really need to consume so much, and if so, whether they’re producing enough to justify such consumption. Data shows that they are consuming much more than they are producing. And this is gradually causing them to mortgage their nation off to foreigners.”
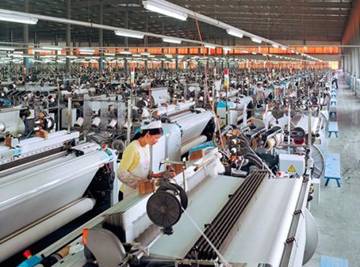
“Similar to many third-world nations that have an inadequate manufacturing infrastructure, America has reverted to a service economy. It’s becoming a nation of the ‘haves and have nots,’ similar to third-world societies. The ‘have-nots’ continue to reach for what they cannot afford through credit spending. In some cases, we already see a change in the way Americans are using credit; from greed to need—paying for necessities with their credit cards.”
Source: America’s Financial Apocalypse, 2006.
Now let’s have a look at the latest income data from the U.S. Census.
In 2009 Americans earning more than $100,000, or 20% of the U.S. population received 50.3% of the nation’s total income. In contrast, the bottom 40% of Americans received a mere 12% of the nation’s income. Americans considered below the government’s official poverty line (14.3%) received only 3.4% of the income.
For the nation’s top 20% of income earners, this represents an increase from a decade ago in 1999, when the top 20% received 49.4% of the income. Meanwhile, the nation’s poorest were slightly better off a decade ago, when the bottom 40% received 12.5% of the income.
This is remarkable considering the fact that higher-income earners were likely to have lost a significant amount of their wealth (and income due to dividends and capital gains) from stock market losses, whereas the nation’s lowest income earners were much less likely to have suffered losses in the stock market.
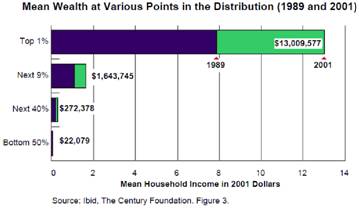
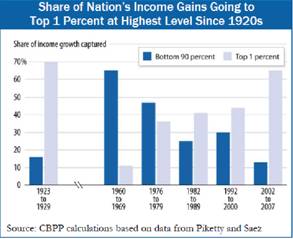
In 2008, the wealthiest 10% of U.S. households received 48.2% of the nation’s total income, up from 34.6% in 1980. Thus, much of this increase was due to the growth of incomes in the top 10% of income earners. Specifically, the top 1% received a much higher percentage in gains, helping to raise the 20% group. Between 1980 and 2008, the share of the nation’s total income going to the top 1% rose from 10% to 21%. This places the U.S. as one of the most unequal nations in the world.
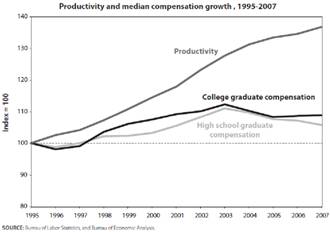
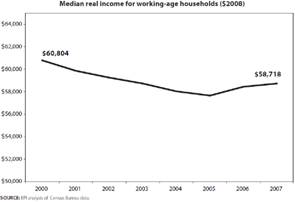
I have discussed the fact that real median wages have not increased since 1999 ever since writing about this trend in AFA. The latest data by the Census confirms this trend is alive and well. According to the Census, the inflation-adjusted income of the median U.S. household fell 4.8% between 2000 and 2009.
What does all of this mean?
As I discussed in AFA and have continued to emphasize since that time, America’s middle-class is becoming extinct.
Meanwhile, its impoverished are becoming more poor. The main reason for this trend is due to the excessive inflation seen in basic goods and services, such as food, energy, healthcare and education, all while Washington partners with corporate America to send good jobs overseas in order to enrich the wealthy elite.
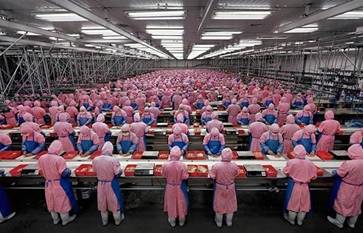
Good jobs, millions of them have been exported overseas by corporations only concerned to find the cheapest labor they can find. This has a dual effect on the wealth and income gap seen in the U.S. because the wealthiest Americans tend to have largest investments in U.S. corporations.
So as Ford Motor, Dell Computers, IBM, and every other U.S. corporation sends jobs to China, India, and other nations, shareholders of these companies make more money because labor costs have been reduced.
The simple fact of the matter is every time you see someone driving an expensive car or pulling up to a large house, you should envy this person. Most likely, these individuals are either in some way responsible for the job you used have before it was shipped off to India, or else they have profited from your lost job. This is the new never-mentioned reality of America.


The charts on this page serve to further nail the point into the ground.
I want you to keep in mind the architects and benefactors of this economic devastation.
The list is extensive and includes hundreds if not thousands of individuals; Wall Street executives who committed securities fraud and have still not been indicted, the Federal Reserve under the leadership of Alan Greenspan, which caused the global bubble, and virtually every politician that has held office in Washington for several years.
Summers, Rubin, Weill, Emanuel, Gramm, Clinton, Gore, Bush, Cheney, Rumsfeld, Mozilo, Fuld, Dimon, Blankstein, Lewis, Raines, Syron, Greenberg and Cayne; these are just a few of the architects and benefactors of America’s destruction.
If these individuals are not brought to justice, I can guarantee you the exploitation, pain and suffering will continue indefinitely as a repeating cycle until you have been completely enslaved. Some argue that this has already occurred.
Already, the evidence is clear that the U.S. is run not by a democracy, but by a fascist government that partners with corporate America and the wealthy elite. This crime syndicate has been in control of the U.S. for many years, but has gained a particularly high level of control over the past ten years.
As many will agree, freedom of speech is nothing more than a myth in the U.S. Instead, we see a tightly controlled corporate media. Protection of property rights in the U.S. has faded over the years. And the so-called free market system so proudly touted by Washington has been MIA from the U.S. economy for many years.

Today in America, instead of real competition, we see an endemic trend of industry collusion. Sure, as a U.S. consumer you have choice. You can select from Wal-Mart or Target, AT&T or Verizon, Home Depot or Lowes, Walgreens or CVS. That’s not indicative of a free market economy.
Over the past couple decades, America has regressed into a nation whereby industry collusion is the law of the land. Industry giants continue to buy out smaller competitors, and then raise prices once competition has faded. In other industries, we see a pseudo-free market system whereby the existence of several competitors gives the appearance of competition. This is seen best in the energy, healthcare and media industries.
This system of collusion really took off during the Reagan years, which initiated a wave or deregulation. Destructive trade policies added to the storm.
The next time you see or read of the media’s hand-selected financial experts, you should ask yourself why they refuse to bring up these issues.
The answer should be clear by now.
They do not care about the truth and they do not care about your well-being. All they care about is lining their pockets. This is why they have been selected by the media as experts. In the end, they support the agendas of the media which is beholden to the interests of Wall Street, Washington and corporate America, the principal perpetrators of America’s criminal syndicate.
Remember, if you are not getting the full truth, you are being lied to.

Background reading material: http://www.avaresearch.com/


By Mike Stathis
www.avaresearch.com
Copyright © 2010. All Rights Reserved. Mike Stathis.
Mike Stathis is the Managing Principal of Apex Venture Advisors , a business and investment intelligence firm serving the needs of venture firms, corporations and hedge funds on a variety of projects. Mike's work in the private markets includes valuation analysis, deal structuring, and business strategy. In the public markets he has assisted hedge funds with investment strategy, valuation analysis, market forecasting, risk management, and distressed securities analysis. Prior to Apex Advisors, Mike worked at UBS and Bear Stearns, focusing on asset management and merchant banking.
The accuracy of his predictions and insights detailed in the 2006 release of America's Financial Apocalypse and Cashing in on the Real Estate Bubble have positioned him as one of America's most insightful and creative financial minds. These books serve as proof that he remains well ahead of the curve, as he continues to position his clients with a unique competitive advantage. His first book, The Startup Company Bible for Entrepreneurs has become required reading for high-tech entrepreneurs, and is used in several business schools as a required text for completion of the MBA program.
Restrictions Against Reproduction: No part of this publication may be reproduced, stored in a retrieval system, or transmitted in any form or by any means, electronic, mechanical, photocopying, recording, scanning, or otherwise, except as permitted under Section 107 or 108 of the 1976 United States Copyright Act, without the prior written permission of the copyright owner and the Publisher. These articles and commentaries cannot be reposted or used in any publications for which there is any revenue generated directly or indirectly. These articles cannot be used to enhance the viewer appeal of any website, including any ad revenue on the website, other than those sites for which specific written permission has been granted. Any such violations are unlawful and violators will be prosecuted in accordance with these laws.
Requests to the Publisher for permission or further information should be sent to info@apexva.com
Books Published
"America's Financial Apocalypse" (Condensed Version) http://www.amazon.com/...
"Cashing in on the Real Estate Bubble" http://www.amazon.com/...
"The Startup Company Bible for Entrepreneurs" http://www.amazon.com...
Disclaimer: All investment commentaries and recommendations herein have been presented for educational purposes, are generic and not meant to serve as individual investment advice, and should not be taken as such. Readers should consult their registered financial representative to determine the suitability of all investment strategies discussed. Without a consideration of each investor's financial profile. The investment strategies herein do not apply to 401(k), IRA or any other tax-deferred retirement accounts due to the limitations of these investment vehicles.
© 2005-2022 http://www.MarketOracle.co.uk - The Market Oracle is a FREE Daily Financial Markets Analysis & Forecasting online publication.