EURGBP and Gold vs Aussie Dollar Signals
Currencies / Forex Trading Nov 15, 2010 - 08:30 AM GMTBy: Ashraf_Laidi
 The escalating negative dynamics surrounding the euro must be assessed carefully when drawing conclusions over EURUSD. A decline below $1.3550 remains unlikely for now. Rather, I continue to favour shorts in EURCAD, EURCHF (see details below), with particular focus on EURGBP in this piece.
There are clear fundamental and technical arguments for why EURGBP will continue its decline. Last week, the pair posted its weekly drop in since January.
The fundamental case is two fold; the euro and sterling sides. On the euro-negative side; EURGBP is weighed by uncertainty as to whether Ireland will need IMF bail-out, Irish political dissent on the budget and LCH Exchange decision to raise the margin on Irish bonds. Irish PM Cowen is urging opposition parties to pass the planned EUR 6 bln adjustment to the budget in order to set aside funds for crucial spending ahead. Failure to do so would prevent the State from undertaking its EUR 50 bln in annual spending. Before we get to the details of EU financing, it is important to note the diminishing chances of any Budget resolution by the Irish parliament on Dec 7.
On the GBP-positive side, the Bank of England's less than hawkish take on inflation boosted the currency across the board. Although the BoE continues to see inflation below the 2% target at the end of its 2-year forecast period, it admitted that more upside risks to the inflation surprising on the upside that would serve to delay any QE2 for now. While GBP fundamentals could face renewed disappointments from the upcoming housing data ahead, GBP remains a relative play with respect to EUR and AUD.
The technicals arguments for a lower EURGBP are the following;

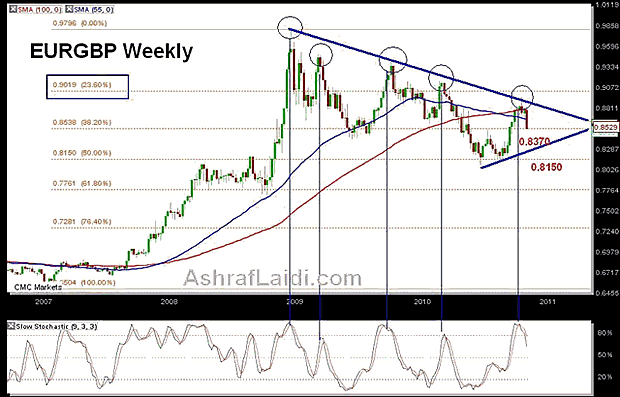
1. 2-year Trendline Resistance Held up. The trendine (blue) extending from the all-time high of 0.9799 (Dec 2008) through the 2009 and 2010 highs was nearly broken last month but without success
2. Death Cross on the Weekly Moving Average. The 55-WEEK MA (blue line) breaks below the 100-WEEK MA for the first time since December 2007. When a moving average falls below a shorter period moving average, it is referred to as a "death cross". A notable death cross occurs when the 55-MA (daily or weekly or month) falls below the 100-MA or the 200-MA. These patterns usually foretell sharp moves in key instruments such as EURGBP.
3. Major Negative Stochastic Turnover. Note the slow stochastic in the lower box has turned lower, a pattern highly consistent with previous selloffs, as shown in the prior 4 circled turnarounds. Stochastics are a measure of momentum or pace of change in price formations.

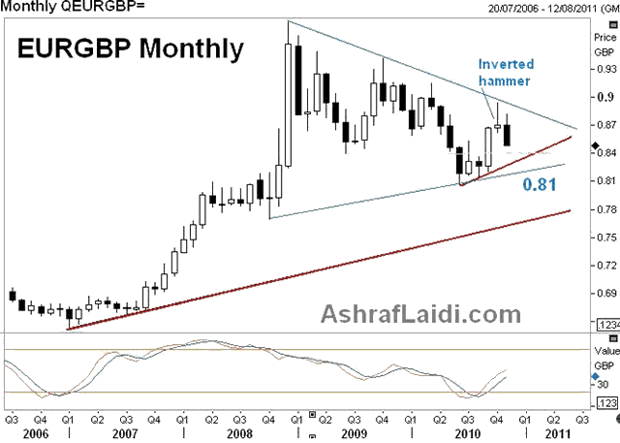
4. Monthly Technicals (chart below). Key monthly reversal after the October candle showed an inverted hammer, which is a typically bearish price formation appearing at the peak of the trend. Such is a text-book reversal signal of a November flow that is already underway.
The aforementioned dynamics suggest further losses towards the prelim 0.8370 target (just below the June low), followed by 0.8150. Any new signal justifying the case of the hawks at the BoE (VAT, weak sterling, rising oil prices), EURGBP would risk a break below 0.8030 and onto 0.78. Only a close above 0.8870 merits re-consideration of this important downcycle. The daily chart may appear to stage short-term bullishness near 0.8550, but only a daily close above 0.86 merits reconsideration of broadening bear move.
What's Gold/Aussie Telling us?

Friday's $47 decline in gold resulted from the run-up in US 10-year yields and the resulting rally in the US dollar. The inverse relationship between USD and gold has not always held up this year. We saw in Q1-Q2 how the inverse relation was reduced to insignificance, partly due to Eurozone credit concerns boosting gold's safe haven flows at the expense of a falling euro and to the benefit of US dollar.
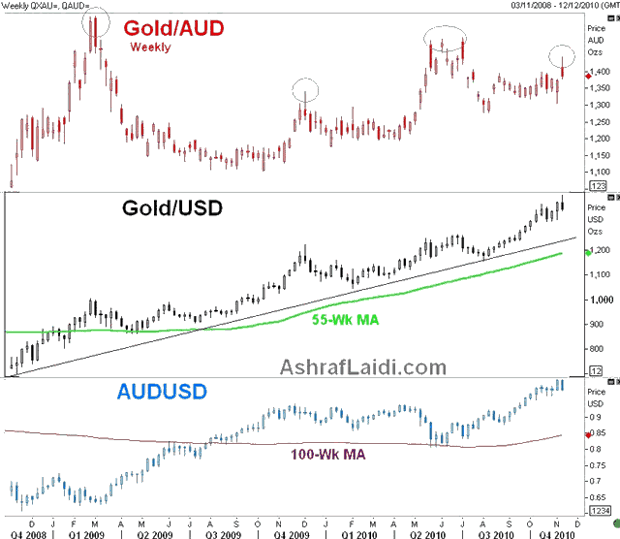
Although I maintain my medium-long term bullishness for gold--seeing $1,550 by Q1 2011, my call for a medium term downleg (below $1,320) is highlighted by gold's movements in terms of the Aussie (Gold/AUD). Note in the weekly Gold/AUD chart below, each of the first three circled peaks coincided with a pullback in Gold/USD (centre chart). Attempting to pick temporary tops in Gold/USD via solely looking at Gold/USD can be difficult these days with Fed's QE2 and Eurozone sovereign issues playing in favour of gold. But if we obtain a clearer downsignal in the value of gold in terms of the stronger Aussie, then it could follow that the precious metal is due for a deeper pullback against all currencies.
The fundamental case for a temporary drop in gold can materialize from surging expectations of further Chinese tightening (rate hikes not just hiking reserve ratios). Continued upside surprise in US data following the 151K increase in October payrolls could also weigh on gold on the notion that the planned $650 bln in QE would be curtailed before Q2. Regardless of whether the announced QE2 program will be completed to the end, the more important fact is that there will always be bond, equity and FX traders who would draw such a conclusion at each and every round of positive US data. Such are the fundamental reasons for having a 2-way market in gold and other instruments irrespective of the validity of the fundamental rationale.
For the technically-oriented trader, note how each of those three peaks in Gold/AUD are illustrated by a typically bearish formation, including bearish engulfing pattern and inverted hammers.
As Gold/AUD risks closing below AUD 1,370, watch the $USD1,350 trendline prevailing since the Jul 28 low. A break below $1,350 would extend losses towards the $1,320 foundation-38% retracement of the rise from the said low.
More details on the use of multi-currency gold analysis in Chapter 1 of my book. For more frequent FX & Commodity calls & analysis, follow me on Twitter Twitter.com/alaidi
By Ashraf Laidi
AshrafLaidi.com
Ashraf Laidi is the Chief FX Analyst at CMC Markets NA. This publication is intended to be used for information purposes only and does not constitute investment advice. CMC Markets (US) LLC is registered as a Futures Commission Merchant with the Commodity Futures Trading Commission and is a member of the National Futures Association.
Ashraf Laidi Archive |
© 2005-2022 http://www.MarketOracle.co.uk - The Market Oracle is a FREE Daily Financial Markets Analysis & Forecasting online publication.


