


EUR/USD Bounce Closing in on Stronger Resistance
Currencies / Euro Nov 19, 2010 - 05:26 AM GMTBy: Seven_Days_Ahead

 The recovery in EUR/USD from the Jun low has, so far, been a 3-wave affair and recently found good resistance. There is now the risk that further weakness will mean curtains for the bulls as upward momentum seeps away.
The FX Specialist view
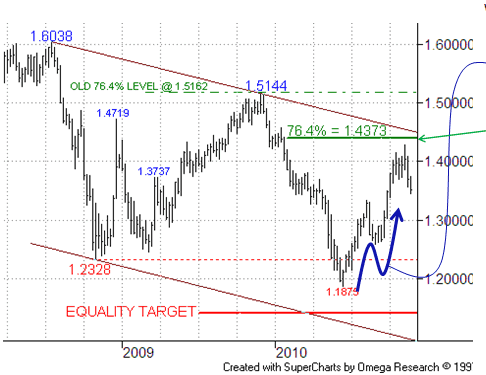 |
WEEKLY CHART So far a 3-wave, corrective structure has developed from the Jun low: - it has failed just ahead of 76.4% resistance, raising questions as to whether the bull move has run its course (note how a former 76.4% level was effective in late 2009). |
|
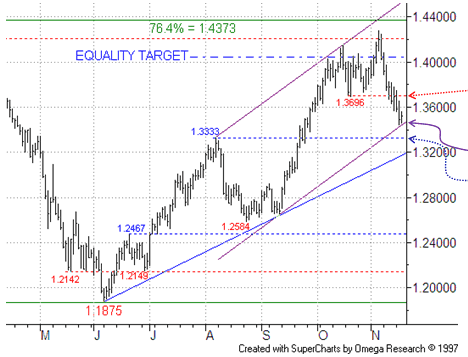
DAILY CHART: After the market failed ahead of the 76.4% retracement level (no requirement for this to be tested) the continued drop below the 20-Oct 1.3696 low has provided a modest sign of momentum loss. However, more important are the current bull channel base (now under pressure) and then the 1.3333 06-Aug high, just above which resides a 38.2% pullback level – violating these supports would have more certain bearish implications. Subsequent rally attempts should then prove temporary ahead of further bear activity. |
Mark Sturdy
John Lewis
Seven Days Ahead
Be sure to sign up for and receive these articles automatically at Market Updates
Mark Sturdy, John Lewis & Philip Allwright, write exclusively for Seven Days Ahead a regulated financial advisor selling professional-level techni44cal and macro analysis and high-performing trade recommendations with detailed risk control for banks, hedge funds, and expert private investors around the world. Check out our subscriptions.
© 2010 Copyright Seven Days Ahead - All Rights Reserved
Disclaimer: The above is a matter of opinion provided for general information purposes only and is not intended as investment advice. Information and analysis above are derived from sources and utilising methods believed to be reliable, but we cannot accept responsibility for any losses you may incur as a result of this analysis. Individuals should consult with their personal financial advisors.
Seven Days Ahead Archive |
© 2005-2022 http://www.MarketOracle.co.uk - The Market Oracle is a FREE Daily Financial Markets Analysis & Forecasting online publication.