


Stock Market Starts December With a Strong Rally
Stock-Markets / Stock Markets 2010 Dec 04, 2010 - 06:36 AM GMTBy: Tony_Caldaro

 This week the market started off the month of December with a strong rally. This was very similar to the strong rallies that started in the month of July (Intermediate wave one), and the month of September (Intermediate wave three) of this multi-month uptrend. Economic reports were more mixed this week than what we have been observing in recent weeks.
The Payrolls report displayed less job growth than expected and a higher unemployment rate (9.8%). Weekly jobless claims rose too. ISM manufacturing and factory orders declined, and the Case-Shiller housing price index displayed less of a rise. On the positive side, the Chicago PMI rose, along with Q3 productivity, monthly auto sales and construction spending. The ADP employment index also rose, as did consumer confidence, pending homes sales, ISM services, the monetary base and the WLEI. For the week the SPX/DOW were +2.8%, and the NDX/NAZ were +2.2%. Asian markets rose 1.7%, European markets gained 1.6%, the Commodity equity group gained 3.1% and the DJ World index rose 3.2%. Bonds were -0.7%, Crude gained 6.6%, Gold rose 3.7% and the USD declined 1.5%. Next week’s economic reports will feature the trade/budget deficits, consumer credit and consumer sentiment.
LONG TERM: bull market
After a multi-week pullback the market rallied late in the week to come within one point of the bull market high at SPX 1227. The NAZ (nasdaq composite) was the first of the four major US indices to make a new bull market high on friday. Our long term count of a five Primary wave bull market remains on track. Primary wave I ended in Apr10 at SPX 1219 after completing five Major waves up from the Mar09 SPX 667 bear market low. Primary wave II followed into July10 ending at SPX 1011. Major wave 1 of Primary wave three began at this time and is still underway.
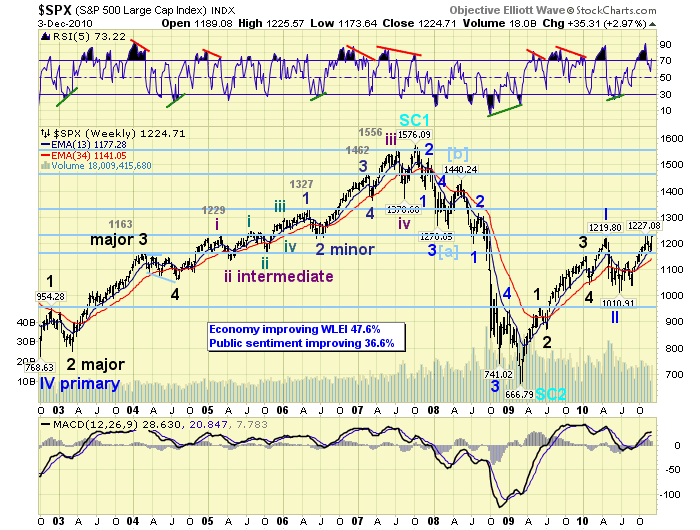
The July10 low coincided with the 4 year Presidential cycle low, and this was followed by the 2 year Tech product cycle low in Aug10. These two important time cycles point to higher prices into the year 2012. While our longer term 34 year cycle suggests a secular cycle low in the year 2016. The actual price low of this cycle occurred in Mar09 at SPX 667. When the current bull market ends, estimated in 2012, it should be followed by a multi-year bear market into the year 2016 before the next secular bull market begins in earnest. In the meantime all cycles point up into 2012. Our bull market projection remains on track as well:SPX Stocks Bull Market Projection
MEDIUM TERM: uptrend high SPX 1227
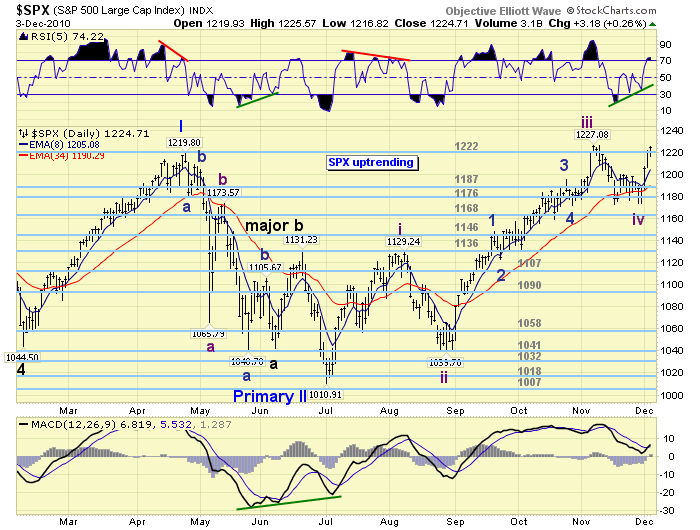
After Primary wave II bottomed in July10 the market started to rally and it generated two WROC buy signals. These buy signals often occur before an uptrend confirmation. The current uptrend was confirmed by OEW shortly thereafter. The first important rally carried the SPX to 1129 in early Aug10 to complete Intermediate wave one. This was the first intermediate wave of five in the Major wave 1 uptrend. A sharp pullback followed in late Aug10 at SPX 1040. This ended Intermediate wave two. The next rally, Intermediate wave three, took nearly three months and topped at SPX 1227 in early Nov10. The recent pullback to SPX 1173 ended Intermediate wave four with a flat, alternating with the Int. wave two zigzag.
This week the market finished that flat formation on tuesday when it re-tested SPX 1174. After a small rally on tuesday the market took off to the upside on wednesday and thursday. Friday we observed some early consolidation, similar to wednesday afternoon, and then a slightly higher rally high at SPX 1226 near the close. With Intermediate wave five underway we can now do some fibonacci/pivot projections for the remainder of this uptrend.
First the SPX needs to clear the OEW 1222 pivot, which stopped Primary wave I and Intermediate wave three. After it does, the next pivot at SPX 1240 offers some resistance: @ SPX 1246 Int. five = 0.618 Int. one. After this is cleared, the next OEW pivot at SPX 1261 should offer some resistance too. When this is cleared, the market will then run into some serious overhead resistance at the 1291, 1303 and 1313 cluster of pivots. In fibonacci terms it is quite a barrier: ;@ 1289 Int. five = 0.618 Int. three, ;@ 1291 Int. five = Int. one, @ 1292 Major 1 (III) = Major 3 (I), and @ 1300 Major 1 (III) = Major 1 (I). As a result of these fibonacci relationships we are now projecting this uptrend should end within the 1291-1313 pivot range in January 2011.
SHORT TERM
Support for the SPX is now at 1222 and then 1187, with resistance at 1240 and then 1261. Short term momentum is beginning to form a negative divergence on the hourly chart. We noted in last weekend’s update that the Intermediate wave four pullback could end by month’s end, (in two trading days), and Intermediate wave five could then begin. The characteristics of this uptrend suggested this scenario, and it played out as anticipated. All uptrends/downtrends have different characteristics. Usually they are too short in time to decipher. But this one has just entered its fifth month.
With the recent rally we are raising our uptrend threshold to the 1187 OEW pivot. Should this pivot be tested again, and then broken, a new downtrend is likely underway. Any pullback, from current levels, should find support between SPX 1199 and 1207. These are the breakout levels we have been monitoring for a few weeks. Resistance to the upside was elaborated upon in the medium term section above. Best to your trading!
FOREIGN MARKETS
The Asian markets were mostly higher on the week for a net gain of 1.7%. India’s BSE led (+4.5%) and China’s SSEC lagged (-1.0%).
The European markets were mostly higher for a net gain of 1.6%. Spain’s IBEX led (+4.2%) and Switzerland’s SMI lagged (-0.7%).
The Commodity equity group were all strong on the week for a net gain of 3.1%.
The DJ World index resumed its uptrend with a gain of 3.2%.
COMMODITIES
Bonds were -0.7% on the week as bond prices continue to downtrend. The 10 YR yield has risen from 2.33% to 3.06% on friday, and closed over 3% for the first time since July10.
Crude soared 6.6% on the week as its uptrend extended. It closed at its highest level in over two years, $89.31. NatGas remains choppy but still rising.
Gold, supported by Silver during its recent pullback, surged 3.7% on the week as its uptrend appears to be extending along with Silver. Updated the short term counts. http://stockcharts.com/def/servlet/Favorites.CServlet?obj=ID1606987&cmd=show[s67199592]&disp=O.
The USD declined on the week 1.5% after getting extremely overbought, and the EURUSD (+1.4%) extremely oversold. The JPYUSD gained 1.6% on the week.
NEXT WEEK
Tuesday kicks off the economc week with Consumer credit. Then on wednesday the volatile weekly Mortgage applications. Thursday we have the weekly Jobless claims and Wholesale inventories. Then on friday the Trade/Budget deficits, along with Import/Export prices and the bi-weekly Consumer sentiment reading. Nothing scheduled on the FED’s calendar except the Flow of Funds report on thursday. Best to your weekend, week and Happy Holidays!
CHARTS: http://stockcharts.com/def/servlet/Favorites.CServlet?obj=ID1606987
http://caldaroew.spaces.live.com
After about 40 years of investing in the markets one learns that the markets are constantly changing, not only in price, but in what drives the markets. In the 1960s, the Nifty Fifty were the leaders of the stock market. In the 1970s, stock selection using Technical Analysis was important, as the market stayed with a trading range for the entire decade. In the 1980s, the market finally broke out of it doldrums, as the DOW broke through 1100 in 1982, and launched the greatest bull market on record.
Sharing is an important aspect of a life. Over 100 people have joined our group, from all walks of life, covering twenty three countries across the globe. It's been the most fun I have ever had in the market. Sharing uncommon knowledge, with investors. In hope of aiding them in finding their financial independence.
Copyright © 2010 Tony Caldaro - All Rights Reserved Disclaimer: The above is a matter of opinion provided for general information purposes only and is not intended as investment advice. Information and analysis above are derived from sources and utilising methods believed to be reliable, but we cannot accept responsibility for any losses you may incur as a result of this analysis. Individuals should consult with their personal financial advisors.
© 2005-2022 http://www.MarketOracle.co.uk - The Market Oracle is a FREE Daily Financial Markets Analysis & Forecasting online publication.