


How to Play the Gold Silver Ratio
Commodities / Gold and Silver 2010 Dec 08, 2010 - 03:36 PM GMTBy: Mike_Stall

 The gold-silver ratio is perhaps one of the first indicators traders looked at to comprehend the state of the precious metals market and accordingly acquire positions. Indeed, it has been out of favor among modern investors who believe that this is one ratio even his barber is tuned in to and a simple sinusoidal movement does not often work. Anything that goes up comes down – while the cliché cannot be disregarded, if an uncomplicated philosophy like that really worked as simply, it would have earned several investors guaranteed profits over time. It is essential to understand that the game in the markets is all about being in the side who are doing things that the majority are not, given that the majority loses. In order to outsmart the majority, we need to look at the gold silver ratio in a way the majority is not.
We attempt to revisit the gold silver ratio in a new light to arm our investors with the right view. The gold silver ratio is not outdated; the view needs to be refreshed. Over the course of this essay, we will establish the traditional rules of mean reversion and how pairs and ratio work the conventional way. The spillover of this essay continues next week where we revisit the ratio play (old way of mean reversion) and also put in other fresh perspectives that will make the ratio more meaningful in the modern day. We will also peek into how the ratio panned out historically and where we are now. Keep reading!
How to Play Ratios
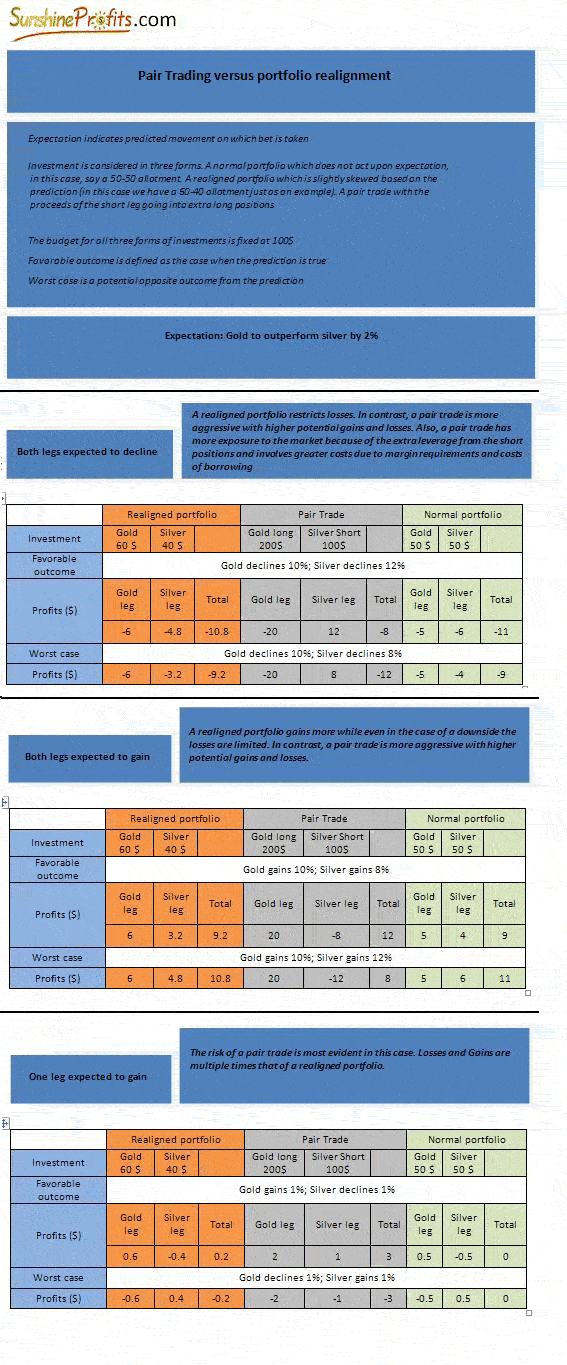
Pair trading is a trading strategy that enables traders to profit from any potential market condition. By taking up two legs (one long and the other short), a pair enables the investor to limit losses and gain from a number of scenarios in comparison to a standalone position that can gain only in case of one favorable fluctuation. In a sense, a pair trade is market neutral. However, a ratio also can be played by other means which come with further limits on profits and losses. If one can predict which way the ratio is going to move, one can also realign his portfolio churning investments towards the outperformer. Most importantly, it must be understood that pair trading is not a long-term investment vehicle. Investors are advised to implement a small part of their capital as speculative capital to benefit from short term/medium term relative price swings. Pair trading is a trading strategy more than an investment option.
The main requirement of ratio play is to identify two related instruments that have a high correlation in day-to-day prices. When the correlation between the instruments weakens, (one instrument moves up while the other moves down) the pair trade would involve shorting the outperforming stock and to long the underperforming one. This is a bet on the "spread" between the two instruments are eventually expected to converge. Realignment would involve redirecting partial investments from the underperformer towards the outperformer, while still staying long on both. This is a play on the relative price swing; as the underperformer picks up relative to the outperformer, profits can be made irrespective of individual leg fluctuations.
Divergence between a pair can be due to temporary demand/supply changes, bulky buy/sell orders for one leg of the pair, significant news about one of the instruments, and so on. The underlying principle of mean reversion is that since the instruments are fundamentally linked, the normal relationship will resume once any temporary effect is subdued.
Any ratio correction can happen in three ways. Both legs move up and one outperforms the other or both move down (where realigning works better). Only in the event of both legs moving in different directions does a pair trade work better. But, risks are higher in case of an unfavorable outcome. We will observe how the illustration below favors realignment in most cases. Also, in our subsequent essays, we will establish why both gold and silver are both expected to grow with one outperforming the other and make the case for portfolio realignment rather than pair trade.
One of the pillars of making trades based on a ratio (such as gold-silver) is the philosophy of mean reversion. Mean reversion is more a surety in pairs because of opposing forces of two correlated instruments forcing the ratio to revert to historical average values (than in case of single stock movements). Imagine two strong magnets (with the force of the magnetic field represented by correlation). Move the two magnets apart and there is a strong tendency of the two to drift back together once the external force weakens. Sometimes the external force is strong enough to drift them sufficiently apart to a degree that the magnetic field is no longer effective or the strength altered. We will analyze methods to detect regime changes further on in our analysis.
Think ETFs
The extraordinary expansion of gold ETFs (Exchange Traded Funds) in the gold market has led to several investors considering it as an alternative investment vehicle. Some analysts have even attributed the current bull market to the increasing purchase of gold by ETF funds. The choice between gold futures and ETFs is beset with pros and cons, but since ETFs are easier to use for most investors, we'll use this asset class in the following part of this essay. The tracking error (how for ETFs price drifts away from the underlying asset - here: gold and silver) is extremely low and whatever error can be attributed to the expense ratio and operational opportunity costs. Please keep in mind that we do not advocate using ETFs as a proxy for long-term investments.
However, when it comes to trading, the point in favor of ETFs is its ease of transaction and liquidity. When playing with ratios it is of utmost priority that your instruments are easy to transact. Also, because both legs of a pair have similar tracking error, the impact of tracking error is nullified and ease of operation takes precedence. Remember, we are not playing the absolute alpha of the instruments but the alpha difference.
We observed several measures of representative tracking error viewpoints on the SPDR Gold ETF closing prices and spot gold. First, we observed something that is already known- a high correlation of 0.9995 (practically 1) between the ETF and spot data. However, we investigated a few other characteristics that provide a real description of the ETF’s tracking ability. The ratio of the prices between ETF and spot should ideally be a straight horizontal line (or minimum deviation) if the tracking if perfect. We observed what we expected – mostly horizontal with little fluctuations that are only significant when magnified sufficiently.
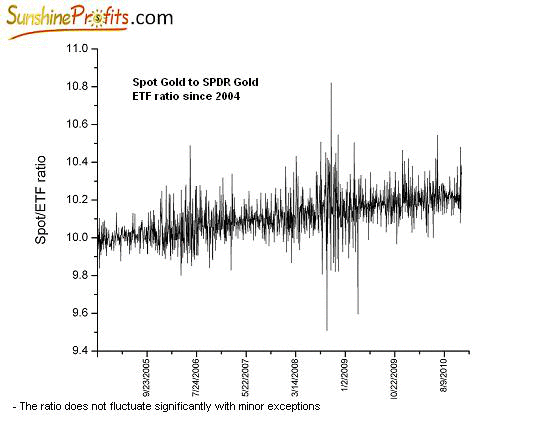
We also observed that the ratio of standard deviation (of EFT-spot ratio) to its mean is 1.11%. This number should serve as a good measure of how much is the average tracking error of ETFs over gold spot. On closer scrutiny it was seen that the bigger deviations were on those days where the spot made a big move and the ETF lagged in replicating the same movement. Standard deviation of absolute changes in ETF-spot gold ratio since 2004 is 0.86. The standard deviation of the ETF touches 2.12 when measured only those days when the spot made a change of over 3%. This highlights how the ETF fairly does well in tracking spot gold with ‘exceptions on exceptional days’ only.
These results are a long term observation given that the period of analysis is from December’04 to current. The bottom line is - ETFs are tracking spot efficiently enough to be considered for frequent portfolio churning. Its easier handling characteristics make it ideal for algorithmic trading as well, whereas futures trading is more complicated. Again, this is not true for long-term investors (because ETFs track poorly in the event of big moves). ETFs are not the ideal proxy for long-term investments. The final stages of the current bull market in precious metals might witness exceptional days where only part of gains is realized if ETFs are chosen as an investment vehicle. Physical positions are definitely less risky.
Silver’s Correlation with Gold Makes It Ideal for Mean Reversion
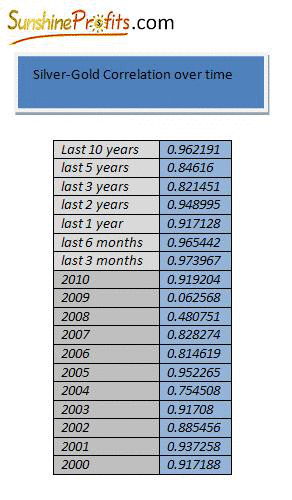
Silver gold long term correlation is visibly high. The overall correlation since 2000 is 0.96. An individual breakup of correlation numbers across years since 2000 shows that barring 2008-09 correlation is strong, enabling possibilities of mean reversion of the ratio. Unlike popular perception, correlation is extremely path dependent rather than a measure of overall movements. For instance, gold and silver prices may both be moving in the same direction but still have a lower correlation if the path is different.
The lower correlation between gold and silver during the last recession can be attributed to the higher volatility of silver in comparison to gold. Unlike the dotcom bubble, the last recession impacted the industry and in turn silver demand. Typically, during stock market crashes, investments are redirected to safe havens gold and silver –seen in the dotcom crash. Silver prices moved in tandem with gold as there was no downward pull due to any industrial downturn, like what plagued silver in the last recession. Consequently, silver became volatile in 2008-09 under the effect of dual sentiments of uncertainty and investment demand and could not gain as steadily as gold did.
Our analysis also revealed that the ratio is not impacted directly by a change in correlation, the mean reversion properties of it is retained even in the event of dampening of correlation numbers. This is because as seen earlier, the long-term correlation is intact and any drop in correlation is only temporary. We took a 3-month (approx 65 trading days) rolling correlation measure to gauge the current relationship between gold and silver across the last ten years. This is because extremely short term correlation calculations are often not indicative and change greatly with the addition of one point more. Similarly, a very long term correlation number does not reflect current conditions efficiently. A quarter of rolling correlation is expected to be an ideal balance between the two extremes.
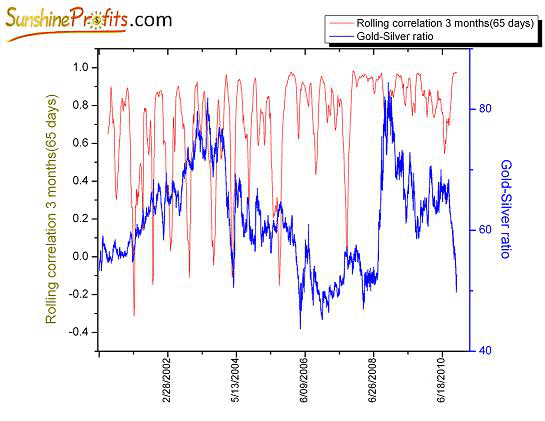
The above graph has 3 important implications. First, there is no long-term impact of the waxing and waning correlation on the ratio. The correlation between rolling correlation and the ratio is marginally negative -0.12 – a number that points to little or no relationship in the long term. Second, for short term trades the effect of some sort of a short term rolling period correlation should indicate the mean reverting properties of the ratio. Investors should also look at the correlation before betting on mean reversion (if the correlation dips, the chances of mean reversion in the short term is lower). Third, the rolling period correlation could also point to regime changes where the ratio has attained a new equilibrium and reverting to the old mean in the medium term is not in the cards.
We will look into the second and third takeaways (mentioned above) in subsequent essays and establish more implementable insights into the gold-silver ratio. Be sure you don’t miss the essay by signing up today and you'll also get free, 7-day access to the Premium Sections on Sunshine Profits.com, including valuable tools and charts dedicated to serious PM Investors and Speculators. It's free and you may unsubscribe at any time.
Remember the keys to ratio play – detecting regime changes, identifying the time horizon of investment, looking into correlation to determine possible peaking and ‘trough’ing and finally choosing wisely between pair trading or portfolio realigning.
Thank you for reading.
Mike Stall
Sunshine Profits Contributing Author
Sunshine Profits
Interested in increasing your profits in the PM sector? Want to know which stocks to buy? Would you like to improve your risk/reward ratio?
Sunshine Profits provides professional support for precious metals Investors and Traders.
Apart from weekly Premium Updates and quick Market Alerts, members of the Sunshine Profits’ Premium Service gain access to Charts, Tools and Key Principles sections. Click the following link to find out how many benefits this means to you. Naturally, you may browse the sample version and easily sing-up for a free trial to see if the Premium Service meets your expectations.
All essays, research and information found above represent analyses and opinions of Mr. Radomski and Sunshine Profits' associates only. As such, it may prove wrong and be a subject to change without notice. Opinions and analyses were based on data available to authors of respective essays at the time of writing. Although the information provided above is based on careful research and sources that are believed to be accurate, Mr. Radomski and his associates do not guarantee the accuracy or thoroughness of the data or information reported. The opinions published above belong to Mr. Radomski or respective associates and are neither an offer nor a recommendation to purchase or sell securities. Mr. Radomski is not a Registered Securities Advisor. Mr. Radomski does not recommend services, products, business or investment in any company mentioned in any of his essays or reports. Materials published above have been prepared for your private use and their sole purpose is to educate readers about various investments.
By reading Mr. Radomski's essays or reports you fully agree that he will not be held responsible or liable for any decisions you make regarding any information provided in these essays or reports. Investing, trading and speculation in any financial markets may involve high risk of loss. We strongly advise that you consult a certified investment advisor and we encourage you to do your own research before making any investment decision. Mr. Radomski, Sunshine Profits' employees and affiliates as well as members of their families may have a short or long position in any securities, including those mentioned in any of the reports or essays, and may make additional purchases and/or sales of those securities without notice.
© 2005-2022 http://www.MarketOracle.co.uk - The Market Oracle is a FREE Daily Financial Markets Analysis & Forecasting online publication.