Will Oil Inflation Destroy America Or Will 2011 Be The Year of The Rabbit?
Commodities / Crude Oil Dec 14, 2010 - 01:20 PM GMTBy: Andrew_Butter
 The good news is that the Saudis are saying $70 to $80 is “Fair”. The bad news is they may change their minds and with oil knocking at the door of $90 and some OPEC malcontents muttering $100, they are starting to look a bit wobbly. Or even if they are “steadfast”, perhaps they won’t be able to pump enough oil to contain prices?
In 1985 OPEC was holding back 11 million barrels a day of capacity, in 1995 that had dwindled to 2 million a day, today no one is sure. The leverage to keep oil prices down is a function of how much “ammo” you have.
In which case oil might start to get priced not at an estimate of the “correct” amount of “blood” to suck out of the world economy, without causing serious harm (Parasite Economics), but instead at the cost to go out and bring 25 million barrels a day or so of “new oil”, on line…like next week.
So how about if oil goes back up to $147 and stays there?
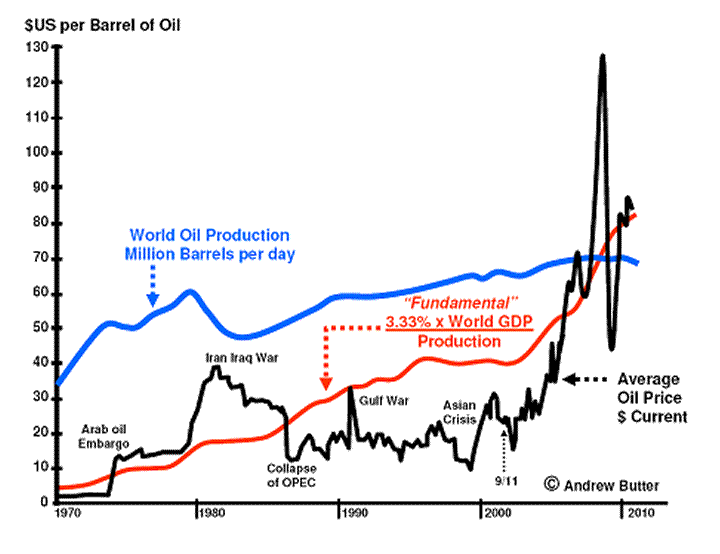
This is an analysis of the “Fair-Price” of oil going back to 1970, before the first oil-shock. The red-line (the fundamental or in valuation-speak the Other-Than-Market-Value), is an estimate of the price at which the world economy does not suffer.

The logic behind that line is at: http://seekingalpha.com/article/240571-bubbleomics-10-year-oil-price-prediction
Let’s pretend for a moment that line is about right, the next thing that’s interesting is what happens when there is “disequilibrium”, or in other words when the actual price of oil is markedly different from the “fundamental”.
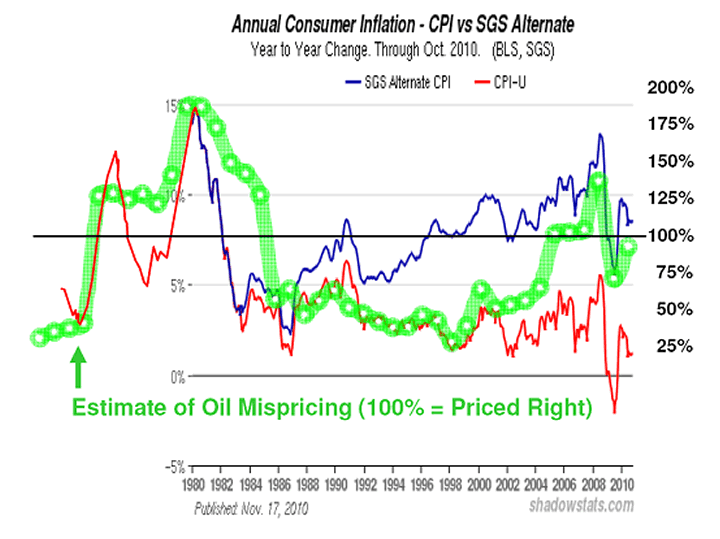
Expressing that as a percentage (actual-oil-price divided by the “fundamental”), and comparing it with a measure of “economic well-being”, for example, CPI in America:
Here is a comparison with two versions; CPI-U which is the “official” figure (red-line) and the Shadow Stats estimate (blue line)

Best-fit, year-on year 62% of changes in CPI-U, can be predicted by oil mispricing lagged one year (so this year’s CPI-U is roughly predicted by last year’s oil mispricing). Plot against the average of CPI-U and Shadow-Stats and the correlation improves.
Sure oil is clearly not the only driver, although eyeballing the chart suggests that a mechanism might be (1) oil gets mispriced up (2) CPI goes up (3) the Fed “tightens” and CPI goes down (along with the economy) (4) oil goes down (5) everyone breathes a sigh of relief. And well when oil is mispriced low, that’s a time of milk and honey, where the “Inflation Targeting” of the Fed can do no wrong.
My view on the Shadow Stats numbers is that they are over-blown, and that the big mistake that the Bureau of Labour made was in relation to Owner’s Equivalent of Rent, but apart from that their numbers are pretty sound, so the big disconnect started in about 2000.
But that’s just detail, what hits me in the face about that chart is:
1: The price of oil or the mispricing of oil reference what the buyers can afford to pay; is a better determinate of CPI-U or whatever, than monetary policy.
2: If the Saudi’s can’t “contain” the price of oil, and the threat of “peak-oil” which even the IEA now concedes is a reality, starts to provide a logic for those countries who have any oil left to keep it in the ground; on the assumption that it will be worth a lot more next year, then prices will go up.
And by-the way don’t put too much faith in corn-ethanol as a saviour, the reality is that you need more oil to make that stuff than you need to make regular gasoline.
If oil prices keep going up and start knocking on $150, then according to that chart CPI however you measure it will go up.
In that case, regardless of Ben’s brave words about being able to cut-off inflation in a heartbeat; there will be nothing the Fed can do about that, outside of pushing up the base rate to throttle-down the economy.
America is unique in the world in that it needs twice the oil to generate one unit of GDP, as anywhere else; and now that the financial engineers who kept the Smoke and Mirrors show on the road for so long, are out of business; if oil does start to blow, could that signal the end of an era?
For the past fifteen years, any discussion about "Peak-Oil" has been countered with the argument - "don't worry your pretty little head… someone will pull a rabbit out of the hat".
If so, the only question that remains is will 2011 be the "Year of the Rabbit", in more ways than one?
By Andrew Butter
Twenty years doing market analysis and valuations for investors in the Middle East, USA, and Europe; currently writing a book about BubbleOmics. Andrew Butter is managing partner of ABMC, an investment advisory firm, based in Dubai ( hbutter@eim.ae ), that he setup in 1999, and is has been involved advising on large scale real estate investments, mainly in Dubai.
© 2010 Copyright Andrew Butter- All Rights Reserved
Disclaimer: The above is a matter of opinion provided for general information purposes only and is not intended as investment advice. Information and analysis above are derived from sources and utilising methods believed to be reliable, but we cannot accept responsibility for any losses you may incur as a result of this analysis. Individuals should consult with their personal financial advisors.
Andrew Butter Archive |
© 2005-2022 http://www.MarketOracle.co.uk - The Market Oracle is a FREE Daily Financial Markets Analysis & Forecasting online publication.


