U.S. Treasury Yields Suggest Stocks Correction in Q1 2011
Stock-Markets / Stock Markets 2011 Dec 17, 2010 - 04:24 AM GMTBy: Donald_W_Dony
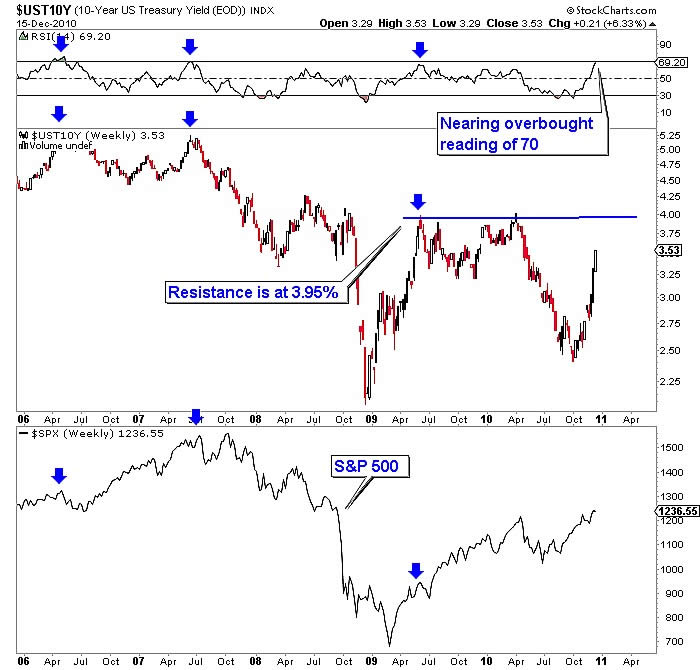
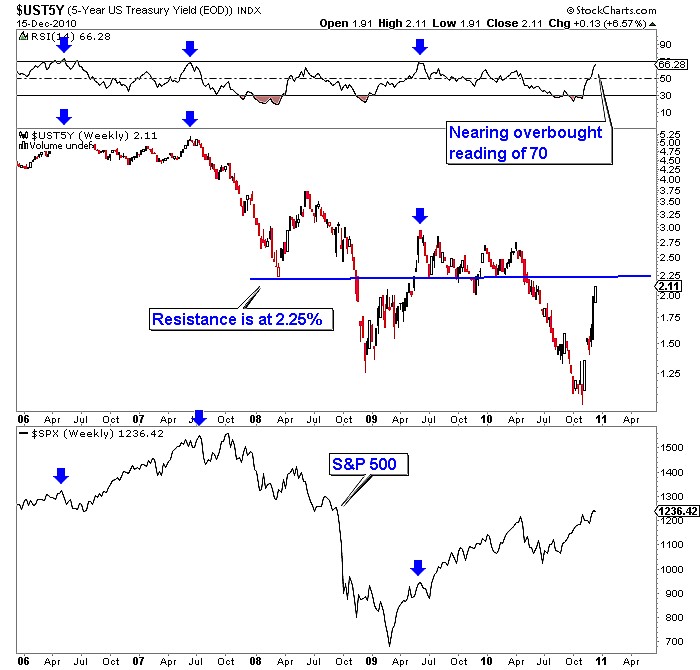
 RSI overbought readings on U.S. Treasury yields have corresponded to corrections in the S&P 500 over the past 5 years. Since 2005, levels of 70 or higher have generated a pullback in price levels for stocks and a retracement for bond yields. The current RSI levels for 10-year and 5-year U.S. Treasuries are nearing that important overbought range. The present RSI readings for mid-term yields are at 69.20 (Chart 1) and short term yields are at 66.28 (Chart 2).

Corrections in the S&P 500 during the last two bull markets (2002-2007 and early 2009 to present) have averaged about 8% when treasury yields reached overbought levels of 70. Examples were in April 2006, July 2007 and June 2009. Current yield levels, however, still have some room to advance in the short term. Market resistance for 10-year treasury yields is at 3.95% and 2.25% for 5-year yields. Both of these levels are above current yields.

Bottom line: Overbought RSI readings in 10 and 5-year treasury yields typically correspond to mild corrections averaging 8% in the S&P 500. Current yield levels suggest there is still room for some short term advancement into January as market resistance remains above present yields. Models for the S&P 500 indicate the next low should arrive in March. This matches the expected time frame for the overbought yield levels in Q1.
Investment approach: During the past fives years, whenever 10 and 5-year U.S. Treasury yields become overbought (RSI reading of 70), there has been a corresponding correction in the S&P 500. Treasury yields should become overbought in early Q1. As models for the S&P 500 suggest a low developing in March, stock indexes are expected to peak by February. The average bull market pullback is about 8% and lasts approximately four weeks.
Investors may wish to use this anticipated low in March as an opportunity to add to current portfolio positions or purchase new holdings. Remember, the strength of the markets are in commodities and developing economies. These two groups are expected to remain performance leaders during this business cycle.
Your comments are always welcomed.
By Donald W. Dony, FCSI, MFTA
www.technicalspeculator.com
COPYRIGHT © 2010 Donald W. Dony
Donald W. Dony, FCSI, MFTA has been in the investment profession for over 20 years, first as a stock broker in the mid 1980's and then as the principal of D. W. Dony and Associates Inc., a financial consulting firm to present. He is the editor and publisher of the Technical Speculator, a monthly international investment newsletter, which specializes in major world equity markets, currencies, bonds and interest rates as well as the precious metals markets.
Donald is also an instructor for the Canadian Securities Institute (CSI). He is often called upon to design technical analysis training programs and to provide teaching to industry professionals on technical analysis at many of Canada's leading brokerage firms. He is a respected specialist in the area of intermarket and cycle analysis and a frequent speaker at investment conferences.
Mr. Dony is a member of the Canadian Society of Technical Analysts (CSTA) and the International Federation of Technical Analysts (IFTA).
Donald W. Dony Archive |
© 2005-2022 http://www.MarketOracle.co.uk - The Market Oracle is a FREE Daily Financial Markets Analysis & Forecasting online publication.


