


Opportunity knocks
Stock-Markets / US Stock Markets Oct 21, 2007 - 07:44 PM GMTBy: Joseph_Russo
 Crises = opportunity. There is no better vantage point from which to anticipate the pending course of events than the effective study and interpretation of dynamic price-chart data.
Despite the preponderance of regular interventions, hype, spin, greed, fear, and the like – if properly read, price-chart data contains the answers to most, if not all of the financial-spheres endless stream of perplexing riddles.
At first glance, the nature of price-data behavior can appear rather complex, erratic, and difficult to figure out – let alone trade.
For those willing to take the time to learn how to read the price action effectively, navigating trades suddenly becomes much clearer, and what used to appear as complex and erratic – will soon make perfect sense.
Once one embraces and accepts the crafty nature of common price-action, the success of one's trading and investment campaigns will improve dramatically.
Following our short-term trading summary and general market commentary, we will present a rare and special series of proprietary trading charts from our subscriber archives.
Our proprietary charts will graphically depict the dynamic price-action landscape as it unfolds. We carefully draft our analysis to be free of bias, highlighting most, if not all of the pending trade-triggers telegraphed ahead of the current price data.
Short-Term Trading Summary
Below is yet another graphic summary of recent trade-triggers and price-target objectives successfully identified via Elliott Wave Technology's Near Term Outlook publication.
The chart above is not a working analysis chart, but rather a graphical summary created to reflect the net effect of our ongoing analysis.
Following our broad market update, we will provide readers with a rare and unique preview of the actual working charts from which we generate the above types of summaries.
The Broad market update
In light of the 20-year anniversary of the '87 crash, we thought if fitting to take a “what-if” peak at what damage (or lack thereof) that an '87-style crash could possibly inflict upon the some of the broad market indices.
The Past 15-yrs in Brief:
The NASDAQ 100
The NDX: clawing at 2200
Just shy of testing a five-year upper trend channel boundary, this formerly wiped-out index is still struggling in recovery mode.
Due in part to its lagging relative recovery, the NDX is suddenly perceived as an undervalued safe-haven darling with plenty of upside opportunity.
Note that a sudden '87 style 20% crash in the NDX does no damage whatsoever to the long-term integrity of the uptrend established from the 2002-wipeout bottom.
Should such an event occur, so long as the crash bottom held, it would obviously then mark a fantastic low-risk, medium to long-term buying opportunity.
Bring it on… Bring it ALL on … 1750 – 2200 – 2300 – 2700 – 3000 - 1100… It matters not to us, we'll be right on top of the action regardless what takes place.
Good thing the fed goosed equity markets higher though - just in case. If they hadn't, we'd probably already be trading near 1750 after Fridays dismal showing.
Currently, despite all the rage, the NDX is over-extended. Another little heads-up is that bullish percents for the NDX registered a clean sector-wide 6% sell-signal reversal after Friday's rout.
Short of a very controlled hyperinflationary dollar collapse - forcing equities to adjust higher in response - upside progress is likely to be limited over the very near-term.
What if… the dollar is on the verge of a massive third-wave collapse rather than nearing a sustainable bottom as one might reasonably expect ? Two years of hugging tightly below the upper trend channel boundary of a long-term downtrend does not bode well over the near and longer term.
Here we show what The Dow would look like amid an imminent 20% decline. Although a retest of 11K would substantially breach the Dow's current uptrend, so long as such a low marked a lasting bottom, the Dow's longer-term trend would remain positive. Ditto for the S&P below.
Oddly similar to the NDX, Gold has broken out to fresh highs for the move as it attempts to reach an eight-year upper trend channel milestone. Should they “let the dollar go” (again), Gold is likely to jump that hurdle, skyrocketing with a host of other tangible commodities, and will not look back until it fly's past 1200 or better. The only thing to stop it is a fiat paper currency called the United States Dollar.
A special preview into the works of elliott wave technology
Three primary disciplines to accurately calibrate price-action data
• First, we rely heavily upon our trusted Elliott Wave Analysis to monitor the progression and maturity of wave status at several degrees of trend. We begin our study at the largest degree of trend with long-term monthly charts, then carefully reconcile all of our counts way down to the smallest actionable intra-day wave structures.
• Secondly, in addition to our dynamic reconciliation of wave counts at all degrees of trend, we monitor proprietary overbought/oversold readings in multiple time horizons. Knowing when price-action within a given set of data is at normal levels of overbought or oversold, provides an important dimension to one's overall view of the time period under study.
• Finally, when trading the trenches of intra-day warfare, taking queues from chart patterns and strategically placed trendlines is the single most effective method in keeping one-step ahead of the price-action. No matter the time horizon, each of our charts contains several of these key boundary markers.
Each marker is a potential weapon with a measured level of firepower. We clearly illustrate where all of these weapons reside, and note what kind of firepower they may carry should the price-action pick them up.
Sure, some are duds and misfire, however many of them engage, and never look back until their targets are captured. Similarly, some may engage, retreat, and then lock back on radar moving directly toward our desired price objectives.
In sum, knowing in advance how and where price-action will react is a HUGE advantage. Such an inordinate edge enriches traders/investors with a unique foresight to clearly visualize, anticipate, and prepare for the dynamic landscape of “what-ifs” that reside immediately in front of the price-action.
Such forward-looking, anticipatory foreknowledge provides the 4 essential elements to booking consistent profits while mitigating one's expected share of losses:
The Four essential elements to booking profits and mitigating loss
• Pre-determine various levels of risk/reward
• Identify specific entry levels suitable to one's trading style/risk tolerance
• Set clear and specific exit targets once a trade is opened
• Awareness of visual boundary markers from which to manage positions and stops
The proprietary charts presented below will illustrate precisely how we incorporate our three primary disciplines in drafting a continual forward-looking price-action landscape. The studies will also convey the practical utility an ease in which one can incorporate, and bring the four essential elements of advantage into actionable alignment with one's specific trading preferences.
“The added beauty of our disciplines - is that they perform rigorously , and with outstanding results in ALL time horizons!”
We have extracted the following analysis directly from our subscription archives without alteration:
Based on our wave analysis, in the October 10 edition of the NTO's Wednesday Evening Post, we were anticipating an imminent near-term top, or a pending breakdown-failure below the lower-boundary of the ending diagonal pattern under observation.
We had already issued justification for low-risk Counter-Trend sell probes the day prior, which were now over 80-pts in profit per the close on October-10.
We also identified prospects for a quick 100-pt rally-thrust to a fresh “throw-over” high in completing the preferred pattern in force.
In the event the market failed such a thrust, and subsequently breached the lower boundary of our triangle, we clearly noted that such a breach would provide signal to a sell-trigger/support-failure citing a point-value target of 150-points beneath triangles boundary marker.
PROPRIETARY CHART FROM ELLIOTT WAVE TECHNOLOGY'S NEAR TERM OUTLOOK
ANTICITPATING A NEAR TERM TOP
10-10-2007 from the Near Term Outlook Wednesday Evening Post
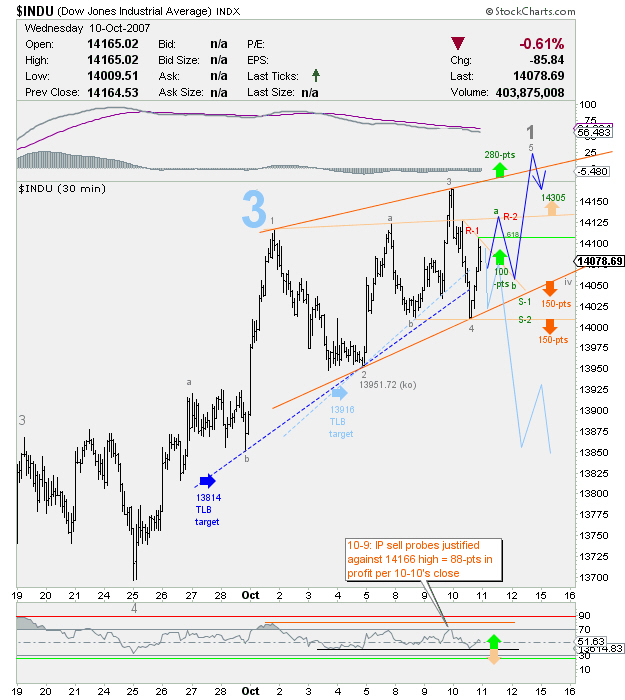
General commentary briefing from the “Wednesday Evening Post”
10-10-2007
“The move down off the high appears corrective thus far – and the market has already rebounded .618 off session lows in the last hour of trade. Two equally plausible ST outcomes are noted. Price-action's response to the updated dynamic support / resistance trade-triggers will determine short-term resolution.”
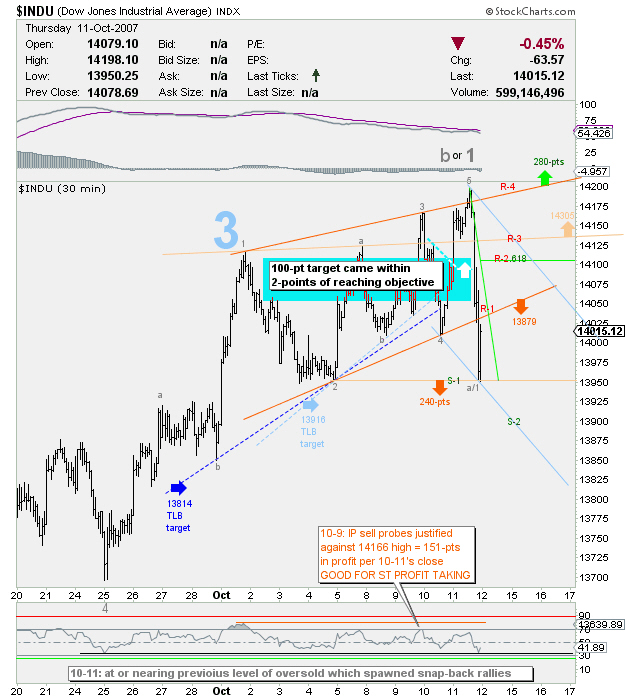
PROPRIETARY CHART FROM ELLIOTT WAVE TECHNOLOGY'S NEAR TERM OUTLOOK
NAILING A NEAR TERM TOP
10-11-2007 from the Thursday's Near Term Outlook
Upon Thursday's open, the Dow tripped our resting buy-trigger citing short-term target to 100-pts of upside thrust “throwing-over” the upper triangles boundary to complete the ending diagonal.
At the highs of the session, the Dow was up over 119-pts prior to reversing sharply after a brief and fleeting throw-over.
From our trade-trigger entry at the open, the high for the day was less than 2-pts shy of our measured 14,200 target. The move back beneath the upper boundary was a first queue to take early profits or reverse short. Subsequent failure after moving above R-3 provided a second exit confirmation for those still holding longs.
Obviously, aggressive discretionary traders may have opted to SAR (stop and reverse short) upon the Dow's re-entry beneath the upper boundary, or alternately upon failure of the Dow to hold above its intra-day move north of R-3's resistance boundary.
Full commentary from Thursday nights Near Term Outlook
Dow Short-Term Trading Chart: Comments posted on Thursday, October 11
Wave Counts / Trade-Triggers / Targets:
“If one were to review yesterday's Wednesday Evening Post, one would find it hard to argue just how perfectly we projected the short-term ending diagonal pattern in development.”
“From here, R-1 defends the 13879 target, while S-1 marks boundary to another sell-trigger/support breach citing an additional 240-pts of downside.”
“R-2 marks a likely retest level at the .618 retracement area from yesterday's low.”
“A sustained move above the .618 level is likely to mitigate near-term downside follow-through – and threaten new historic highs.”
“At its apex, R-3's dual markers identify a (pending) falling parallel upper-boundary of resistance along with a modestly rising trendline associated with the marginalized 14305 target.”
IP Counter-trend Probe Campaigns / Targets captured :
“ST/CT traders probing short from 10-9's alert, have likely taken at least 100-pts profit near the lows or by the close of Thursday's trade.”
“Once a ST probe follows through as desired, and momentum reaches a ST extreme – CT-traders must be quick to take profits – or at least protect the lion's share of money earned so as not to give it all back in a day.”
“Since our last ST buy-trigger from yesterday's evening post only captured 98 of the 100 points targeted , we cannot claim 100%-perfection – but we came pretty-damn close! FYI, the trigger to cover those longs (for PROFIT) was price action coming back beneath the R-3 level.”
We will end our proprietary chart preview with Friday's outcome (below) to show the relative actionable accuracy of the previous day's comments above.
Take-away points from Thursday's comments relative to Friday's price action:
“ ST/CT traders probing short from 10-9's alert, have likely taken at least 100-pts profit near the lows or by the close of Thursday's trade.”
“Once a ST probe follows through as desired, and momentum reaches a ST extreme – CT-traders must be quick to take profits – or at least protect the lion's share of money earned so as not to give it all back in a day.”
- For Short-Term Counter-Trend traders acting on 10-9's sell-probes, which were over 100-pts in profit per Thursday's close, our suggestion for such traders to have taken GOOD quick-profits on such positions near the previous lows or by the close, proved accurate.
- We had graphically noted in the previous chart, that the Dow was at or nearing previous levels of short-term oversold that had previously spawned snap-back rallies.
- On Friday, at its highs, the Dow was indeed snapping back – up over 85-pts intraday and closed the session up 77.96.
“A sustained move above the .618 level is likely to mitigate near-term downside follow-through – and threaten new historic highs.”
- The above reference to a sustained snap-back rally beyond the noted .618 retracement level also proved accurate.
- The rally on Friday (shown below) approached the .618 retracement level referenced. Should one care to look, trade on the following Monday breached the .618 level by whisker in the course of a single 30-minute bar, then subsequently sold off confirming the stated inference of near-term downside follow-through.
We do not predict prices, nor do we issue specific buy and sell recommendations in advance of trade-triggers electing, or upon price-targets achieving objectives.
Although we graphically identify explicit entry-triggers along with point-values and price-target objectives, decisions to place orders and manage trades through fruition are the sole the responsibility of each individual.
The Near Term Outlook covers the short-term Dow, S&P, and NDX five-days-per-week, and issues near-term updates for the Dollar, Gold, Crude Oil, and the HUI two times per week.
Should readers have interest in obtaining access to Elliott Wave Technology's blog-page, kindly forward the author your e-mail address for private invitation.
Opportunity is knocking … Anyone home?
Trade Better / Invest Smarter...
By Joseph Russo
Chief Editor and Technical Analyst
Elliott Wave Technology
Copyright © 2007 Elliott Wave Technology. All Rights Reserved.
Joseph Russo, presently the Publisher and Chief Market analyst for Elliott Wave Technology, has been studying Elliott Wave Theory, and the Technical Analysis of Financial Markets since 1991 and currently maintains active member status in the "Market Technicians Association." Joe continues to expand his body of knowledge through the MTA's accredited CMT program.
Joseph Russo Archive |
© 2005-2022 http://www.MarketOracle.co.uk - The Market Oracle is a FREE Daily Financial Markets Analysis & Forecasting online publication.