Stock Markets Heading Lower Due to Systematic Destruction of the Financial System
Stock-Markets / Financial Crash Oct 22, 2007 - 01:04 PM GMTBy: Captain_Hook

 A week ago if you would have told me past a muted quarter end window dressing related ‘jam job' the funds were going to push prices to either new or recovery highs in a multitude of markets I would have said ‘not likely', but that's exactly what happened. But then that's what happens in a surreal world where reality has become stranger than fiction. Moreover, that's what happens when our social elite condones the systematic destruction of our financial system in hyperinflation. That's the fact Jack. And anyone who thinks different should provide a better answer for why gold is going parabolic than the clever buffoons on CNBC last Friday rejoicing the phony inflation numbers that justify another rate cut for complicit fraudsters. Why else is gold going parabolic then – why?
Below is an excerpt from a commentary that originally appeared at Treasure Chests for the benefit of subscribers
Not surprisingly then there is never mention of hyperinflation on CNBC because once people figure out they are being defrauded by the lot the 'jig' will be up. In returning to reality now however, and as per our discussion last week regarding a potential ‘hyperinflation signal' that could be triggered in trade of the CBOE Volatility Index (VIX) this past Friday, again, one could not write this stuff it's so strange, but it finished right on 18, leaving the semi-informed observer having to guess as to whether a signal was actually provided or not. I say ‘semi-informed' because given what appears to be a ‘flat' (3 – 3 – 5) corrective affair exceeding a two-thirds retrace in taking the VIX down to these levels, the more informed trader already knows the next move higher should not be impulsive. This means we have more upside in stocks once a corrective move higher in the VIX transpires, with the anticipated move (at this point) in stocks being the inverse of the projection provided for the QQQ tracking ETF (QID) seen in the attached directly above in Figure 2. Furthermore, it should be noted the current move higher in stocks will not be complete until the VIX hits the 16 area to complete the flat; again, as seen in the attached directly above. The fact this did not occur Monday with the big rally is just an example of more price fixing in my books.
Does this evaluation mean we are totally out of the water with respect to this being a crash year? Answer: Definitely not, where once all the shorts that are positioned to take advantage of the current similarity to the 1987 set-up are squeezed out, stocks should then fall. As postulated last week, such an outcome could occur post options expiry on October 19 th with the October / November panic window still open. So far though, besides a few causalities the only people we have panicking are actually the authorities themselves. The reason they are doing so is to avoid waking a far bigger mob than exists in the financial circles with a deflation scare. A lot will depend on how Chinese stocks trade after their New Year holiday this week. Chinese stock markets are shut for a week, where it will be interesting to see what affect this hiatus has on trade. Chinese stocks are poised for a bubble degree crash at any time, and they pose a threat to the buoyancy of global equity markets, with both crude oil and to an extent gold held within this grouping as ETF's would likely suffer in a genuine liquidity crunch. Further to all this, it should be noted that as per our comments last week the Hang Seng has now attained both Fibonacci resonance related / sine resistances set against the Dow / Hang Seng Ratio diverging higher. This out-performance on the part of the blue chips is suggestive weakness lies ahead. All Chinese stock markets are now poised for significant corrections barring hyperinflation.
Thus, no seasonal ‘all clear' in the equity complex can be given until October has passed in its entirety, especially if our view of what could happen after the 19 th becomes a reality. If we do make it through October unscathed, historical market students will view any weakness in November as having no lasting effect, where stocks should be expected to rise until next year. This is the circumstance required for a more natural exhaustion to the current market environment of successive / perpetual short squeezes, where once the current batch of shorts is squeezed out, one would think they might hesitate to do so again into a period of seasonal strength. Of course we know from reading above concerning the flat that has developed in the VIX trade pattern this is not likely, but as you will see below in further study, a major top in stocks during the October / November panic window now upon us is possible if history is a good guide. This would be the one that not many saw coming except ardent market / history students, predicated on a natural exhaustion of the larger speculative cycle brought about by a preemptive panic on the part of authorities. For this reason then, because it involves a ‘natural exhaustion' process, such a possibility must be taken seriously. We will have more to say on this below.
What else could cause a panic this fall? If asked, many would say there's always the possibility of more US bank failures that accelerates the flight of capital out of US dollars ($) currently underway. But this would just be an excuse to print more money in my opinion. Look at the British example. Northern Rock goes down and now the public is even paying the dividends . Paulson was over there a few weeks back to ensure they understand it's a ‘blank check' policy when it comes to these things. And the people over at CNBC are wondering why gold is going up. Anyway, in returning to topic, without a doubt if there is any one single factor that could roil the markets this fall, it's got to be a now likely Senate ratified across the board tariff on Chinese imports scheduled for a vote soon. I am talking about ‘markets' here because it's a Chinese retaliation in US debt markets that would cause interest rates to rise that would in turn take the stock market down no matter how many hedges are in place. And not just US stocks either, but Chinese stocks as well, where as seen above they are now in position for a post-bubble collapse from both technical and sentiment related perspectives. It will be interesting to watch this play out, because if the Chinese cause troubles this year, the Olympics would likely be a flop in 2008. Would they sacrifice the Olympics? And is this why US politicians are doing this now? Both hot questions at the moment that could affect a multitude of markets from a liquidity related perspective.
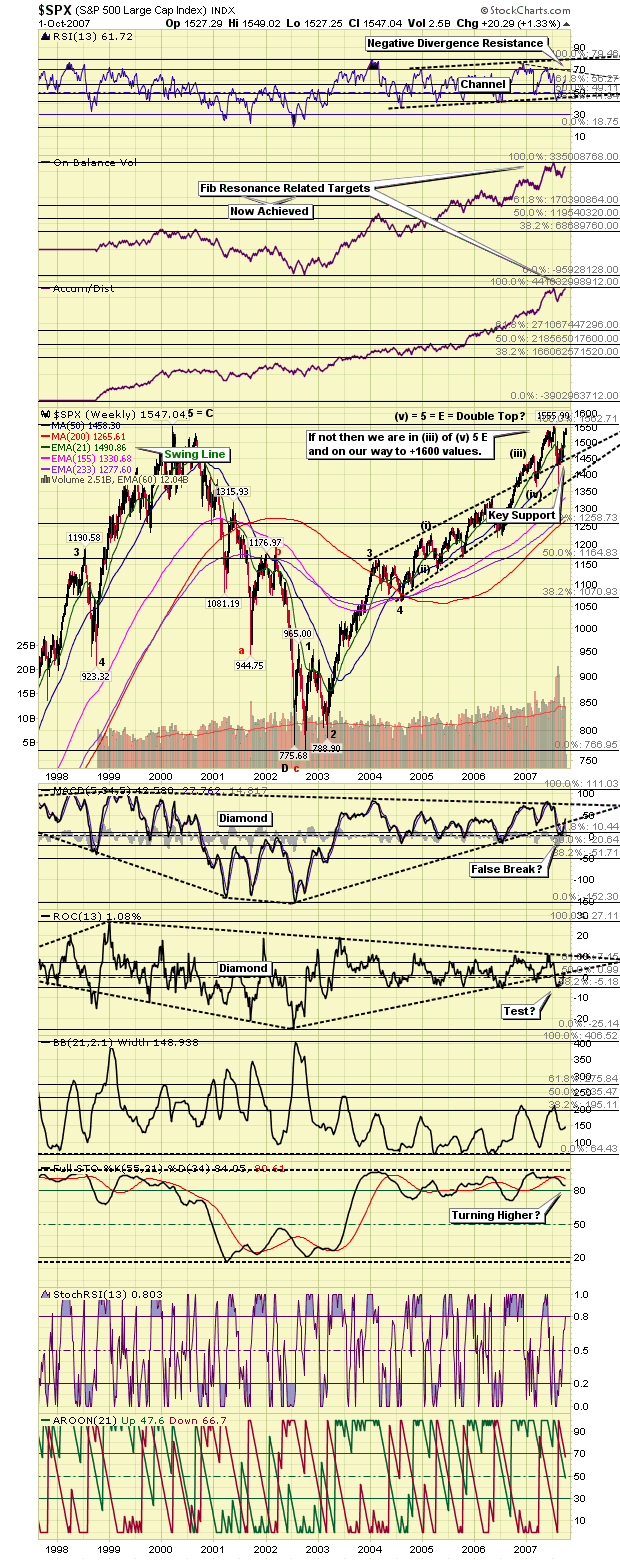
And there are more reasons to be concerned about gold here, with a historically reliable COT related sell signal in the trade at present. Combine this with deteriorating stock market internals , a condition that is bound to have an effect on general price levels at some point soon all things considered, and a very strong argument one should be increasingly cautious at present appears to be prudent. Of course there is nothing prudent about market players these days, where it would not be surprising at all to witness a COT related short squeeze higher into early October prior to any of these concerns becoming material, so if one is looking to place hedges against long positions here, you might wait until we can confirm more short positions have been squeezed out. As it stands right now, it appears instead of increasing players being squeezed out after the Fed induced ‘jam job' last month, the net result has been just the opposite. This is quite surprising behavior, and has bullish implications at least for the short-term. In this respect a break above the large round number at 1550, as per our Progressive Interval System (PI) , would trigger a technical buy signal measuring up to the next 50-point interval at 1600, not to mention a double top breakout buy signal. Here is a snapshot of the S&P 500 (SPX) that illustrates this possibility. (See Figure 1)
Figure 1
Along these lines, we would be amiss in not pointing out a closing basis double top breach buy signal has now been triggered in gold in exceeding last years highs, where when combined with the fact September also produced an all-time record high average monthly close as well, now means gold has ‘blue sky' potential from a technical perspective. How does one know what will likely happen from here? Certainly if you were strictly a COT player, or wave counter for that matter, one would be inclined to take profits this week. Moreover, it doesn't take much imagination to expect a strong Employment Report this week in knowing such an outcome would support the dollar ($), hurt gold, and possibly aid the short squeeze in stocks. For this reason I think a surprisingly strong Employment Report this Friday is a given, where estimates provided by supposedly trustworthy government officials will be skewed in such a fashion. Thus, in knowing seasonal strength in the third year of a Presidential Cycle normally runs out this week, combined with the fact shorts are getting squeezed as we speak, perhaps it's not such a bad idea taking a few chips off the table at this time.
In terms of decision making in this regard, what you may wish to do is watch for a close below $725 (initial interval related support), and then $700 as indications of a short-term trend change for gold, as per tenants associated with our PI attached above. And in looking at the trade overnight it appears the corrective sequence associated with a stronger Employment Report may have already begun, with gold down some $15 in yesterday's trade. With gold approaching the psychologically important large round number at $750 Monday such an attack was not surprising of course, where authorities best get a grip on this tiger before it escapes the zoo entirely. The only problem is gold is already out of its cage, where behind the scenes authorities are in full fledge ‘panic mode' characterized by a ‘blank check' approach in papering over all problems now, a policy that is in force around the world today. So be careful about being too bearish on gold, where channel support currently resides at approximately $680. Here, it would take a three-day close below this level to signal an intermediate term top is in place. What's more, it should be noted the preferred Elliott Wave Count for gold is only calling for an approximate four-percent correction at this time.
This makes sense from the perspective the current correction is artificially engineered based on fraudulent data provided by US price managers in attempting to get gold back in its cage. After all, this kind of thing has worked before. The only problem this time around of course is not just the US, but all Western economies are on the ropes for real, meaning past a little charade on coming weeks to shake things up a bit, the $ should return to free fall mode quite soon if there's any saving the US consumer, and in turn the global economy. So, as long as the larger equity complex remains in tact, expect corrections in gold to be shallow, where it should continue to discount accelerating inflation as long as the stock market continues to go parabolic. This of course would be a reflection of forces associated with hyperinflation at work.
Naturally then, it makes a great deal of sense to attempt gaining the best perspective on where exactly stocks are going from here. As you can see from what has already been discussed above, this is no small feat these days given screws associated with the levels of complexity in the markets appear to be turning like never before. Of course an astute market historian / observer could take issue with such a claim. Here, the thinking is nothing is different seasonally compared to last year, never mind compared to back in the 30's, meaning all that matters is market dynamics and not the news of the day. Based on this understanding then, it should be no surprise price managing Wall Street types (think bankers, brokers, and politicos) are out in full force at present taking advantage of the perception it's ‘really bad' this time. This is how they entice new victims into buying their stock market crash insurance you see. Then, because the economy is imploding and in need of repair, authorities are sanctioned in printing a bunch of new money , which they proceed to distribute to their agents (think The Matrix), who in turn drive stock market futures higher to entice hair brained 25-year old hedge fund managers and brokers back into the stock market. And it appears the current population of short sellers is as stubborn as any in the past as well, where price managers have them right where they want them at present. So, if you think this squeeze will be over tomorrow, you had better get some stress medication because you will likely need it.
Further to this vein of thought, you may now understand better why we say it's not the news that matters, but how the investing public reacts to it. In this respect there is a certain degree of irony in the fact short sellers return to the market every year at this time, a time of seasonal strength. Each year however the news keeps getting worse, making it appear that at a minimum hedging strategies should be employed by calculating market participants, which is of course exactly what is happening at present with put / call ratios rising. Perhaps a greater irony however is in the fact not only are price managers getting what they want with prices remaining stable through this presumably tenuous time; but more, the brokers and bankers are making yet another fortune at it again this year (selling crash insurance and trading revenues), where stocks in this group made a decided turn higher in reflecting this just this week. I don't know how long this will last if market rates turn higher later this month (think in response to tariffs on Chinese goods), but it appears those buying at current levels are confident history should be ignored past the fact that since 1999 October has been the strongest month of the year for US stocks. Just don't tell these traders September is normally weak though, not like what we had last month.
Still one such as myself must wonder about talking with respect to years ending in ‘7' at this point because it appears such talk causes people to go out buy disaster insurance (think puts) only to be part of the problem in this regard. I call it a ‘problem' because of course when the larger short squeeze finally does exhaust itself thoughts of deflation will need be entertained. And according to the historical trading parallels I am about to show you, such thoughts may need to be entertained sooner than you think, where as talked about above, once we are through this period of anticipated weakness in October / November, prices could finally be set to fall for real due to an exhaustion in speculative behavior on the part of market participants. Or in other words, they finally get fed up with paying for their bankers / brokers kid's braces and opt out of future (and expensive) speculating / hedging / risk management programs. One does need wonder exactly how many two-by-fours across the forehead these guys will need before they come to this realization. I think they are up to somewhere between 20 and 30 now, which must be giving at least a few bears a headache at this point. At least this is what one would think in looking at the next three charts below, where the over all message is whether it's here in the November time frame or in March next year, an exhaustion in this regard should be taken as a credible risk to the stability of stocks. This is of course because if history is a good guide, and whether it's predicated on either a calendar day count or trading day tally, the stock market's days are numbered. (See Figure 2)
Figure 2
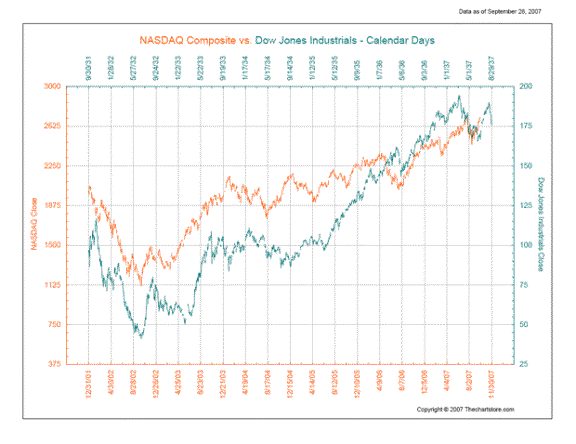
Source: The Chart Store
In looking at all three comparisons here, clearly the one that appears to be playing out to script best at present is the above, where with the market's new found attraction to large cap tech stocks the NASDAQ has been out-performing of late. In this respect then, one should notice an exhaustion to this trend would call for a top in the broads in and around November, just days away now. But the banks are doing their best to get people borrowing again, and if they are successful in igniting the larger credit cycle again, it's possible they pick up the ball from tech past possibilities suggested in the above. This of course would open a new can of worms (inference intended), along with extending the rally in stocks to the trading day tally discussed above and pictured below. Moreover, this would also render possibilities associated with Figure 3 shown here null and void. (See Figure 3)
Figure 3
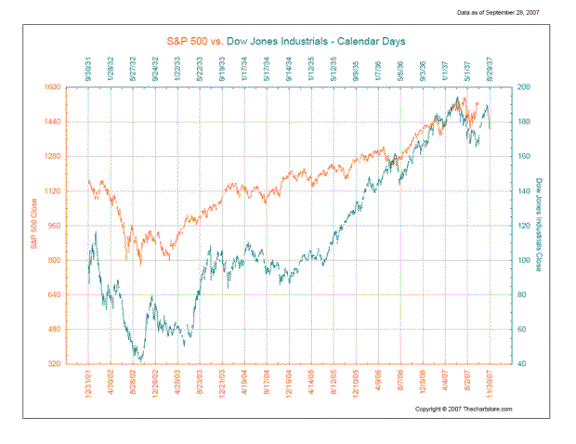
Source: The Chart Store
As you can see below however, even if such an extended outcome were to become a reality, gains past current prices would be quite limited. So, one does have to wonder if the risks associated with equities past this point are worth the reward in a conventional sense. What does the term ‘conventional sense' mean here? Only that the only other possibility past what you see in these figures represents the employment of hyperinflationary policies on the part(s) of governments world wide, where prices literally continue to melt higher from here. Impossible you say – not with the discipline of the bond market to keep inflation in check. While this thinking is possible for responsible men, without a doubt the characters running the show today (think Goldman Sachs) don't see it that way, where even Citigroup (theoretically the bank that could lose the most due to a rising gold price in being the largest US institution of this variety) has now been forced into this dangerous and unsavory brand of thinking. (See Figure 4)
Figure 4
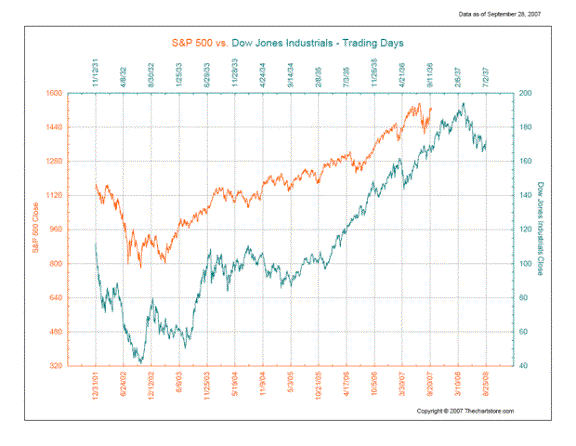
Source: The Chart Store
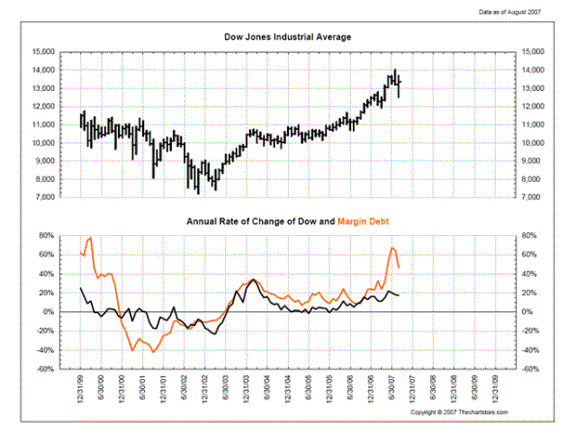
Imagine that, the bankers would have you believe they are now ‘pro-gold'. Things must really be bad out there if this is the case, no? What's more, one must wonder just what would happen to gold in coming months if stocks do in fact stall here. You see the entire equity complex, and to an extent gold (as a liquidity depended commodity at times), depends on continued inflationary policy around the world, which in turn depends on governments continuing to support one another, a condition that is especially true with respect to the Chinese supporting US debt markets in keeping these consumers on ‘life support'. Here if the global liquidity nexus were to be broken, interest rates around the world would rise considering the inflation behind the scenes, and past liquidity related concerns gold would eventually catch a bid as a currency alternative the likes of which would undoubtedly surprise even the more optimistic in the crowd. In the meantime however, and further compounding concerns regarding the stock market at present [apparently we should all be hoping for hyperinflation now apparently because the alternative (deflation) is not a pleasant thought], if interest rates were to rise here, not only would real estate suffer a death blow, but this chart of margin debt conditions on the New York Stock Exchange (NYSE) is suggestive stocks would suffer a similar decline compared to what occurred post the tech bubble in 2000. Please note the below does not include the surge associated with strength seen in September, which would complete the pattern to specification when compared to the year 2000 sequence. (See Figure 5)
Figure 5
Source: The Chart Store
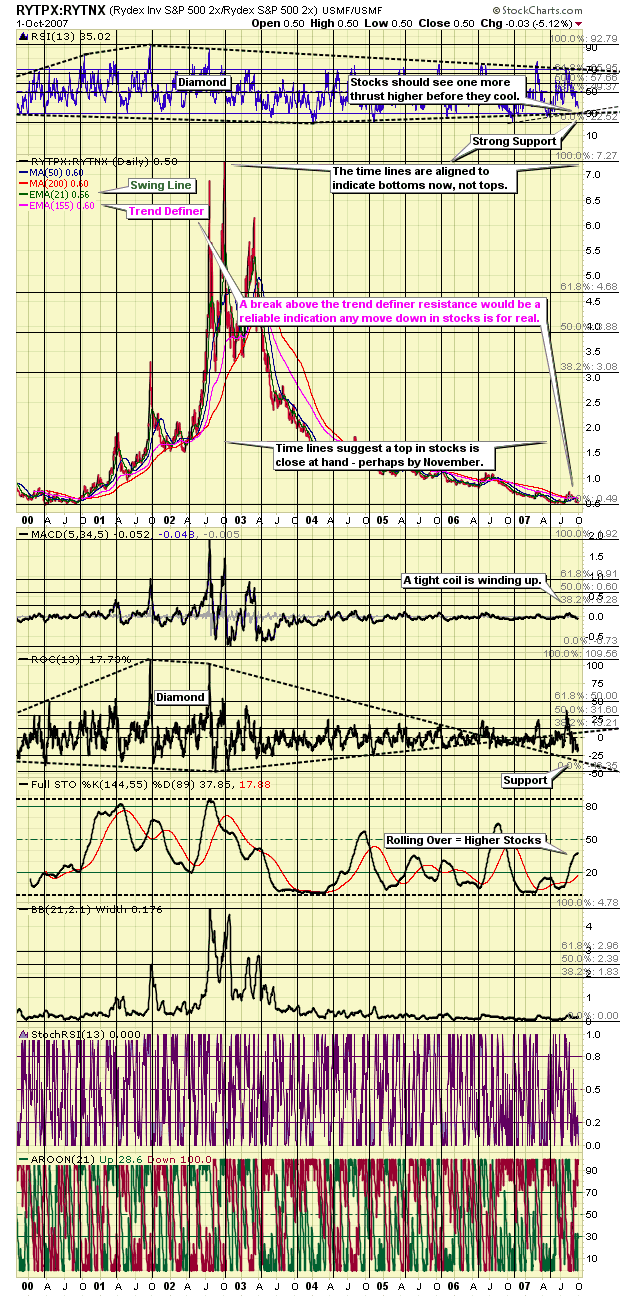
Need more proof you should be worried about stocks in the near future? Since we appear to be gripped in a history lesson here today, why don't we fall back on an old standard in measuring such probabilities, that being the Rydex Ratio . As noted in the chart below, one should recognize this picture is in fact consistent and supportive of the view a significant top in stocks is close; again, and as per the above, possibly as close as the November time frame. Moreover, if the measure in RSI indicated below is a good guide, which history has in fact proven, then we should see a surge in stocks up into the 1580 area on the SPX tops, which just so happens to be long-term channel resistance seen here on this daily plot found in the Chart Room. (See Figure 6)
Figure 6
With all this known then, the question arises, are we about to repeat history in not heeding its lessons? And more specifically, are price managers finally about to hit the wall in terms of how they can affect prices given the totality of factors contributing to inflationary globalization trends? This is certainly the message we are getting in the above history lesson here today. Nobody knows for sure though, because as noted earlier with respect to investor psychology, within this highly speculative environment, if an outcome is thought to be likely, chances are insurance salesman will be around to sell you some disaster protection, which of course just feeds price support mechanisms in the markets set against a constant flow of liquidity.
Unfortunately we cannot carry on past this point, as the remainder of this analysis is reserved for our subscribers. However, if the above is an indication of the type of analysis you are looking for, we invite you to visit our newly improved web site and discover more about how our service can help you in not only this regard, but on higher level aid you in achieving your financial goals. For your information, our newly reconstructed site includes such improvements as automated subscriptions, improvements to trend identifying / professionally annotated charts , to the more detailed quote pages exclusively designed for independent investors who like to stay on top of things. Here, in addition to improving our advisory service, our aim is to also provide a resource center, one where you have access to well presented ‘key' information concerning the markets we cover.
On top of this, and in relation to identifying value based opportunities in the energy, base metals, and precious metals sectors, all of which should benefit handsomely as increasing numbers of investors recognize their present investments are not keeping pace with actual inflation, we are currently covering 71 stocks (and growing) within our portfolios . And more recently we have been focusing on the Red Lake gold camp, hosting some very interesting emerging opportunities. In this regard I have just returned from a due diligence trip and will be providing a report to subscribers later this week. This is another good reason to drop by and check us out.
And if you have any questions, comments, or criticisms regarding the above, please feel free to drop us a line . We very much enjoy hearing from you on these matters.
Good investing all.
Captain Hook
http://www.treasurechestsinfo.com/
Treasure Chests is a market timing service specializing in value-based position trading in the precious metals and equity markets with an orientation geared to identifying intermediate-term swing trading opportunities. Specific opportunities are identified utilizing a combination of fundamental, technical, and inter-market analysis. This style of investing has proven very successful for wealthy and sophisticated investors, as it reduces risk and enhances returns when the methodology is applied effectively. Those interested in discovering more about how the strategies described above can enhance your wealth should visit our web site at Treasure Chests
Disclaimer: The above is a matter of opinion and is not intended as investment advice. Information and analysis above are derived from sources and utilizing methods believed reliable, but we cannot accept responsibility for any trading losses you may incur as a result of this analysis. Comments within the text should not be construed as specific recommendations to buy or sell securities. Individuals should consult with their broker and personal financial advisors before engaging in any trading activities, as we are not registered brokers or advisors. Certain statements included herein may constitute "forward-looking statements" with the meaning of certain securities legislative measures. Such forward-looking statements involve known and unknown risks, uncertainties and other factors that may cause the actual results, performance or achievements of the above mentioned companies, and / or industry results, to be materially different from any future results, performance or achievements expressed or implied by such forward-looking statements. Do your own due diligence.
Copyright © 2007 treasurechests.info Inc. All rights reserved.
Unless otherwise indicated, all materials on these pages are copyrighted by treasurechests.info Inc. No part of these pages, either text or image may be used for any purpose other than personal use. Therefore, reproduction, modification, storage in a retrieval system or retransmission, in any form or by any means, electronic, mechanical or otherwise, for reasons other than personal use, is strictly prohibited without prior written permission.
Captain Hook Archive |
© 2005-2022 http://www.MarketOracle.co.uk - The Market Oracle is a FREE Daily Financial Markets Analysis & Forecasting online publication.


