


Stock Market Elliott Wave Analysis and Forecast for Week Starting 10th Jan
Stock-Markets / Stock Markets 2011 Jan 10, 2011 - 02:00 AM GMTBy: Tony_Caldaro

 2011 was off to a good start as equities rallied and economic reports improved. Both the Payrolls report and ADP showed increases in employment, and the unemployment rate dropped. Auto sales, factory orders, construction spending, ISM services/manufacturing, consumer credit, M1-multiplier, and the WLEI all continued to improve. The only negatives were a slight increase in weekly jobless claims and a decline in the monetary base. The market responded with a new uptrend high at SPX 1278, extending the uptrend into its six month. For the week the SPX/DOW were +0.95%, and the NDX/NAZ were +2.30%. Asian markets gained 0.5%, European markets gained 0.1%, the Commodity equity group was flat, and the DJ World index was flat. Bonds gained 0.2%, Crude lost 3.3%, Gold slid 3.7%, and the USD gained 2.7%. Next week will be highlighted by the FED’s Beige book, Retail sales and the CPI/PPI.
LONG TERM: bull market
The March 2009 bull market continues to unfold as anticipated. The current six month uptrend now equals the previous longest uptrend of this bull market: July09 – Jan10, and oddly enough covers the same time period. The wave formation from the Mar09 low remains clear. Five Major waves up completed Primary wave I in Apr10. Next a three month correction for Primary wave II into July10. Then Major wave 1 of Primary wave III has been underway ever since.
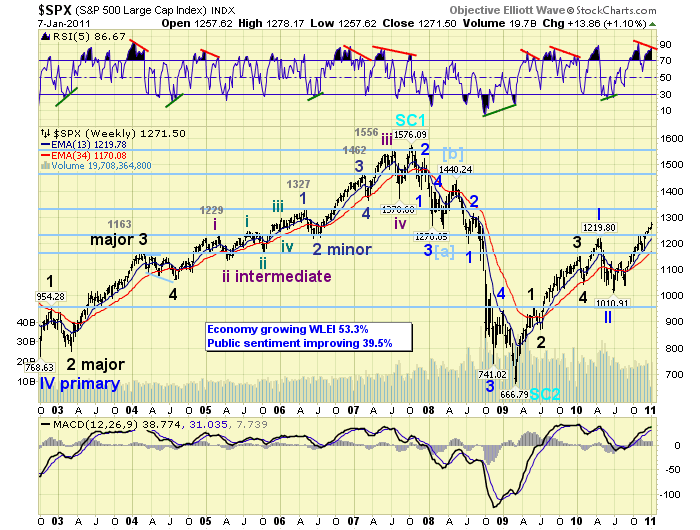
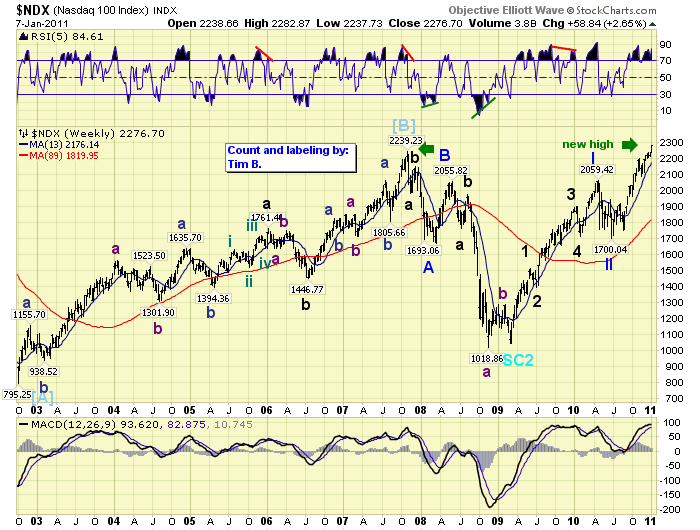
The five Major waves of Primary wave III should occur this year in 2011. Naturally Major waves 2 and 4 should provide significant corrections as Primary III unfolds. However, based on our estimates, (http://caldaro.wordpress.com/2010/09/26/spx-bull-market-projection/), we could see SPX 1500+ before year end. Fueling the bull market in the SPX/DOW has been the Tech sector. The NDX, just this week, has already exceeded its 2007 high.
MEDIUM TERM: uptrend
This uptrend, which started in July10 at SPX 1011, has been a bit tricky at times but it has stayed the course. The August pullback pressured the uptrend, but the market held its support levels and moved higher. The milder November pullback also pressured the uptrend, and again the market held support and moved higher. Overall this one wave, (each trend is a significant wave), has moved from 1011 to 1278. A gain of better than 26% in roughly six months.
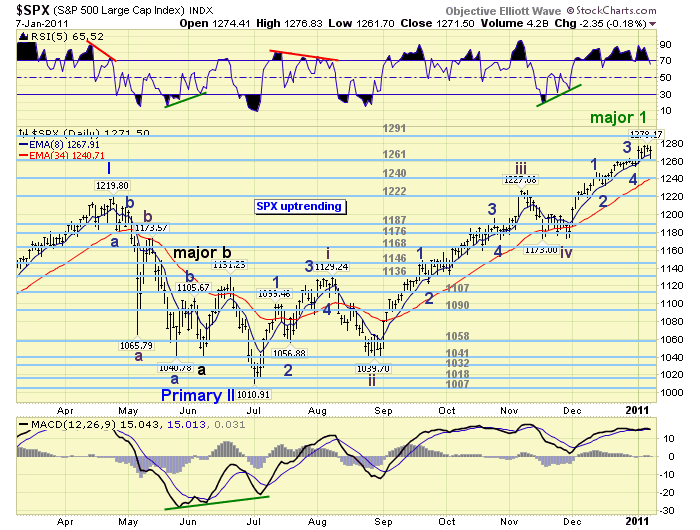
We have labeled this Major wave 1 uptrend as its five Intermediate waves have unfolded. Each of the three rising Int. waves also subdivided into five Minor waves. This is classic bull market activity. While our target for Major wave 1 has been the OEW 1313 pivot. We observed, during friday’s market activity, a potential weakening in this uptrend. Our mantra of anticipate, observe, and then adjust when necessary is always at work. As a result we posted two potential counts for this last rally: Int. wave five of Major wave 1. The first suggests that Major wave 1 ended at thursday’s SPX 1278 high. The second, posted on the DOW chart, is only Minor wave 1 of Int. five completed at thursday high.
Technically the US market remains steady. All nine of the SPX sectors remain in uptrends, the NYAD has been making new highs, and only three of our fifteen world indices are in downtrends. The only real negatives are an uptrending USD and a negative divergence on the weekly RSI, see weekly chart above. Nevertheless, after six months of generally rising prices and possibly a potential 2.5% more on the upside, we opted to make the tentative Major 1 top as the primary count and the tentative Minor wave 1 as the alternate. Should the market start making higher highs, then the OEW 1313 pivot is in play again. If not, we could experience about a 9% correction into February as Major wave 2 unfolds. Basically, it’s time to get cautious medium term.
SHORT TERM
Support for the SPX remains at 1261 and then 1240, with resistance at 1291 and then 1303. Short term momentum dropped to oversold on friday, after a negative divergence on thursday, and is now rising.
From the Int. wave four low at SPX 1173 we have observed five rising waves: wave 1 SPX 1247, wave 2 SPX 1233, wave 3 SPX 1263, wave 4 SPX 1254, and wave 5 SPX 1278. At first we labeled the first two waves as Minor waves 1 (1247) and 2 (1233), then the next two waves as Minute wave one (1263) and two (1254), and this fifth wave as Minute wave three (1278). During friday’s pulback, however, our potential Minute wave four (1262) overlapped Minute wave one (1263). This is an EW/OEW violation, suggesting a different count is unfolding. After a review of the OEW short term charts and the public charts posted, we decided to accept the five waves up from the Int. wave four low as five Minor waves and updated the charts. We posted this in the friday update, and commented about it in the comment section of thursday’s update well before the close.
Going forward we can use the following criteria to determine which of the two tentative counts (SPX/DOW) are in play. First, if the SPX starts making new highs then the DOW count is at work. Second, if the SPX breaks the OEW 1261 pivot range the DOW count has not been eliminated, but the SPX count gains in probability. Third, if the SPX breaks the OEW 1240 pivot range a downtrend is likely to be confirmed with a break of the OEW 1222 pivot range. This next week should help clear up which of the two potential counts are at work.
FOREIGN MARKETS
The Asian markets were mixed on the week for a net gain of 0.5%. Only China’s SSEC remains in a downtrend, but India’s BSE uptrend has become quite choppy and may be just a B wave.
The European markets were mostly higher on the week but the net gain was only 0.1%. Spains’s IBEX is in a downtrend along with Switzerland’s SMI. The IBEX is certainly worth observing in the coming weeks and months.
The Commodity equity group was mixed on the week and ended unchanged. All three indices remain in uptrends.
The DJ World index remains in an uptrend but finished the week unchanged.
COMMODITIES
Bonds gained 0.2% on the week. We continue to see some improvement in the Bond market and its current downtrend may be in the process of being reversed.
Crude lost 3.3% on the week and its five wave – five month uptrend is coming under pressure. The daily and weekly RSI display a negative divergence.
Gold lost 3.7% on the week, ending its six month uptrend with a diagonal triangle fifth wave on monday. It is now in a confirmed downtrend with support around the $1315 area.
The USD started off the year by reversing its downtrend into another uptrend while gaining 2.7% on the week. The currencies have been quite volatile of late. The EUR (-3.6%) confirmed another downtrend, and the JPY (-2.3%) remains in its downtrend.
NEXT WEEK
Tuesday kicks of the economic week with Wholesale inventories. On wednesday we have Import/Export prices, the Budget deficit and the FED’s beige book. Then on thursday the weekly Jobless claims, the PPI and the Trade deficit. On friday, we end the week with the CPI, Retail sales, Industrial production, Consumer sentiment and Business inventories. The FED has nothing scheduled at this time. Best to you and yours this new year!
CHARTS: http://stockcharts.com/def/servlet/Favorites.CServlet?obj=ID1606987
http://caldaroew.spaces.live.com
After about 40 years of investing in the markets one learns that the markets are constantly changing, not only in price, but in what drives the markets. In the 1960s, the Nifty Fifty were the leaders of the stock market. In the 1970s, stock selection using Technical Analysis was important, as the market stayed with a trading range for the entire decade. In the 1980s, the market finally broke out of it doldrums, as the DOW broke through 1100 in 1982, and launched the greatest bull market on record.
Sharing is an important aspect of a life. Over 100 people have joined our group, from all walks of life, covering twenty three countries across the globe. It's been the most fun I have ever had in the market. Sharing uncommon knowledge, with investors. In hope of aiding them in finding their financial independence.
Copyright © 2010 Tony Caldaro - All Rights Reserved Disclaimer: The above is a matter of opinion provided for general information purposes only and is not intended as investment advice. Information and analysis above are derived from sources and utilising methods believed to be reliable, but we cannot accept responsibility for any losses you may incur as a result of this analysis. Individuals should consult with their personal financial advisors.
© 2005-2022 http://www.MarketOracle.co.uk - The Market Oracle is a FREE Daily Financial Markets Analysis & Forecasting online publication.