Another Consequence of Zero Interest Rates
Stock-Markets / US Interest Rates Jan 20, 2011 - 03:38 PM GMTBy: Andy_Sutton
 Over the past two years, I have visited the topic of the consequences of our new zero rate world on several occasions. Despite media ramblings about ‘free’ money stimulating the economy and igniting another 2005-esque period of time, there have been several very negative consequences. Obviously, pathetic rates of return on what are traditionally referred to, as ‘risk-free’ assets are one well-understood development. There are others. This week we’ll take a look at the specter of zero-rates from a risk management perspective and demonstrate exactly how much our world has changed. Perhaps, ironically, the news is not all bad; there is a bit of a silver lining in here!
The ‘Pre-Crash’ World
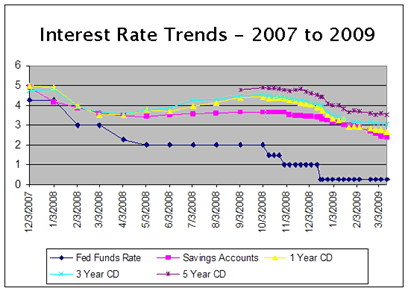
It was not uncommon as recently as 2006 or so to be able to put together a portfolio of equities, a few bonds, and some open or closed end funds and easily target a double-digit yield. Keep in mind that was just the yield and did not count for capital appreciation. When I penned the pilot issue of our Centsible Investor in November of 2007 (coincident with the market top), the yield on the first firm analyzed was 14.87%. I remember it like it was yesterday. The standard deviation (a measure of volatility) on the same firm was 18%, which was fairly representative of the volatility of the S&P500. The yield on the 10-Year Treasury Note was around 4.36%, and a 1-Year CD was bringing around 4.5%. Designing a portfolio with a target yield of 8-10% was easy and could be done without taking on a lot of risk.
One question I want everyone to consider before reading any further is: has it gotten any cheaper to live your life since then? I ask this because common Mediaspeak will have you believe that the cost of living has dropped significantly since then and as such it is ok that a good yield is about as hard to find as an honest politician. Clearly, if your cost of living has stayed the same, the precipitous drop in yields has caused you hardship at a bare minimum.
Before & After
Let’s take a 10-asset model portfolio and analyze it over several periods and demonstrate what has transpired. For our factor of comparison we’ll use the DJ Total Market Index (Aka Wilshire 5000). The composition of the ‘model’ is three Canadian Energy Trusts, three non-US fixed income closed-end funds, a US Bond ETF, and three global high-dividend paying closed-end funds.
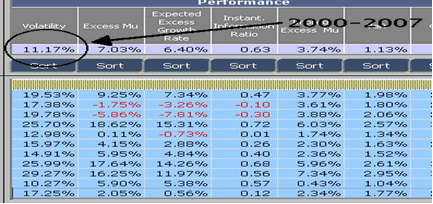
From January 1, 2000 through November 30, 2007, the vitals on this model were as follows:
Risk-Free Rate: 4.5%
Average Yield: 8.9%
Standard Deviation: 11.17%
Expected Return beyond the Risk-Free Rate: 3.5%
Portfolio Beta: .28
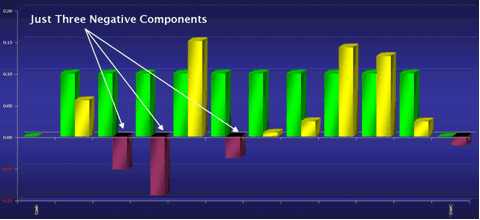
It is obvious from the above that this ten asset model was well-diversified, and performed quite well despite the bear market of the early part of the decade even though there were 3 losers out of 10 during the 7 year period. From a capital appreciation standpoint, the model didn’t grow all that much, but it certainly produced good income along the way.
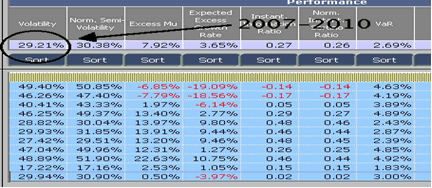
Now let’s take a look at the same 10-asset model from December 1, 2007 through the present. We’ll use the same factor (Wilshire 5000), and will change only the risk free rate, which we’ll set at 1% to reflect the current rate picture. Here are the particulars:
Risk-Free Rate: 1.0%
Average Yield: 4.78%
Standard Deviation: 29.67%
Expected Return beyond the Risk-Free Rate: .79%
Portfolio Beta: .77
Obviously aside from the decrease in yield is the increase in portfolio volatility. Not only that, but the principal took quite a beating as well and finally recovered in January of 2010. This assumes that the investor chose to ride out the storm and didn’t take any evasive moves, choosing to continue collecting dividends.
I understand that this period obviously includes the 2008-2009 panic, but the point is a simple one. The individual who was quietly invested for the first part of the decade had the rug yanked out from under them. The investor who could have lived very nicely from the dividends alone resulting from a $500,000 portfolio has suddenly had to dip into an already shrunken principal to continue the same standard of living.
And perhaps the most important thing, our hypothetical investor is taking on MUCH more risk and experiencing more volatility for a significantly lower return.
An Unlikely Parallel
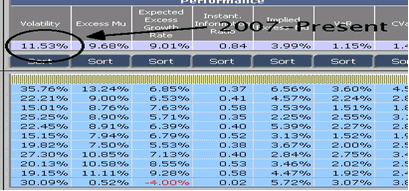
Let’s now present a second ‘model’, this one consisting of 10 preferred stocks. I’ve mentioned preferreds before and many people eschewed them since they don’t generally provide the same opportunities for capital appreciation as common stock. Yet, in a discussion about income, preferreds definitely have their place. Generally, preferred shares are thought to be lower yielding (more conservative in nature), which has generally been true. Let’s see what’s happened in the past few years though. Our preferred model consists of all preferreds, the DJ Total Market Index (Wilshire 5000) as the factor for comparison, and a risk-free rate of 1.0%. 6 of the preferreds are utility firms, 2 are multinational manufacturing, one is a pharma company, and there is one food company.
Risk-Free Rate: 1.0%
Average Yield: 6.44%
Standard Deviation: 11.53%
Expected Return beyond the Risk-Free Rate: 9.01%
Portfolio Beta: .21
What is amazing is that the preferreds, with their vanilla, conservative reputation, are outperforming the dividend ‘achievers’ over the past three years, and doing it with roughly 30% of the volatility. Incredible isn’t it?
While the above reality has certainly been present for quite some time, it is amazing how many folks who are active in investing and the financial world still haven’t caught on to the change in paradigm. It has been over three years since the Dow peaked in late 2007. This is certainly not meant to serve as a knock against anyone, but rather to point out that as people, we are creatures of habit and that old habits die hard. An old cliché is that fortune favors the bold, but I would submit that in this case, maybe fortune just happens to favor those who know where to look.
By Andy Sutton
http://www.my2centsonline.com
Andy Sutton holds a MBA with Honors in Economics from Moravian College and is a member of Omicron Delta Epsilon International Honor Society in Economics. His firm, Sutton & Associates, LLC currently provides financial planning services to a growing book of clients using a conservative approach aimed at accumulating high quality, income producing assets while providing protection against a falling dollar. For more information visit www.suttonfinance.net
Andy Sutton Archive |
© 2005-2022 http://www.MarketOracle.co.uk - The Market Oracle is a FREE Daily Financial Markets Analysis & Forecasting online publication.


